Weather Products
This page covers the portion of Task C. Weather Information from the FAA-S-ACS-6C Private Pilot Airman Certification Standards pertaining to weather services and products.
Overview
- When obtaining weather information, start looking far in advance
- Use standard sources of weather information, such as apps and online
- For example, Prog Charts provides a forecast 7 days out
- Start big picture and then zoom in
- Look at frontal activity, pressure systems
- See AIM 7-1-2
TIP
More importantly than memorizing all of the products below, which are constantly being changed, updated, and shut down, it is important to have a general understanding of what information is needed and how to retrieve it using the available products.
- Aviation weather services are how we get information about the weather
- The output of these various services and products can be catagorized as either:
- Observation
- Forecast (and outlook)
- Another catagorization of weather products is
- Textual
- Graphical
- Yet another categorization is
- Surface
- Upper-air
- We use weather products to get information about the following:
- Want to know pressures zones (e.g. High, Low), as good/bad weather associated with high/low pressure. Also H and L imply wind direction around them, can enable flight to be planned with tailwind, for example.
- Want to know more about pressures via isobars, as can further help indicate winds.
- Want to know areas of poor visibility/ceilings, for determining extent to which flight can be VFR/IFR, for example.
- Want to know freezing level, to avoid icing, for example.
- Also want to avoid adverse conditions for safety reasons, e.g. convective activity, icing.
- Also from winds/temps aloft can get temp lapse rate, to give another indicator of stability.
Textual Products
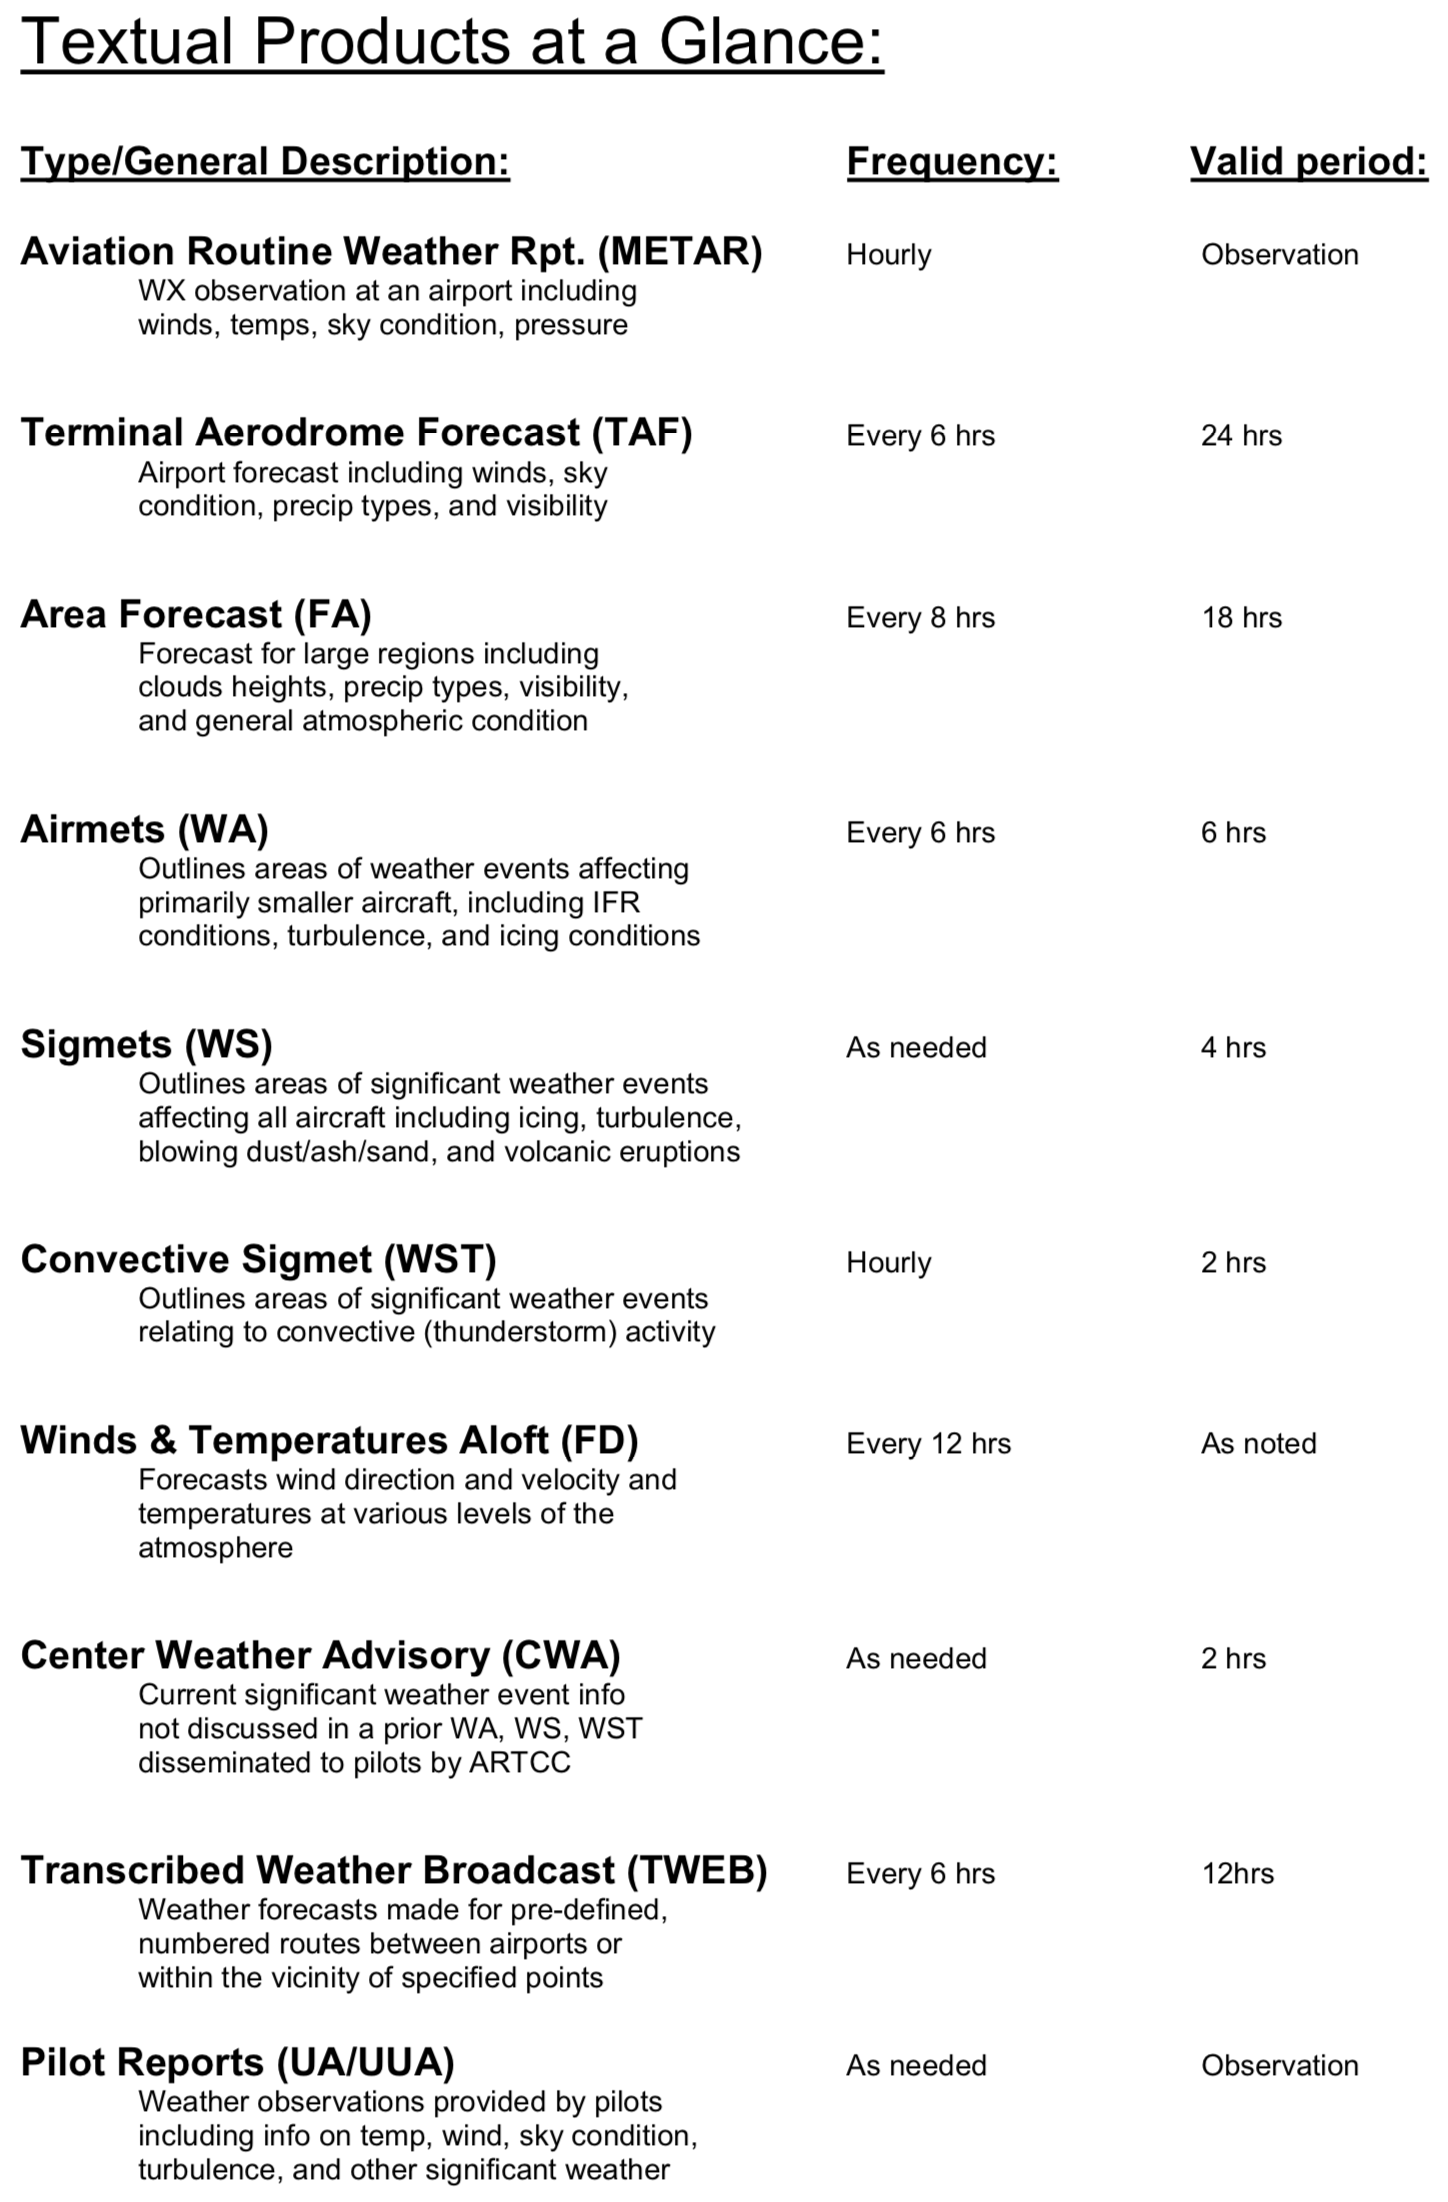
- Note: only textual products used to have letter acronyms for them.
- This seems to have changed with the graphical area forecast (GFA)
Graphical Products
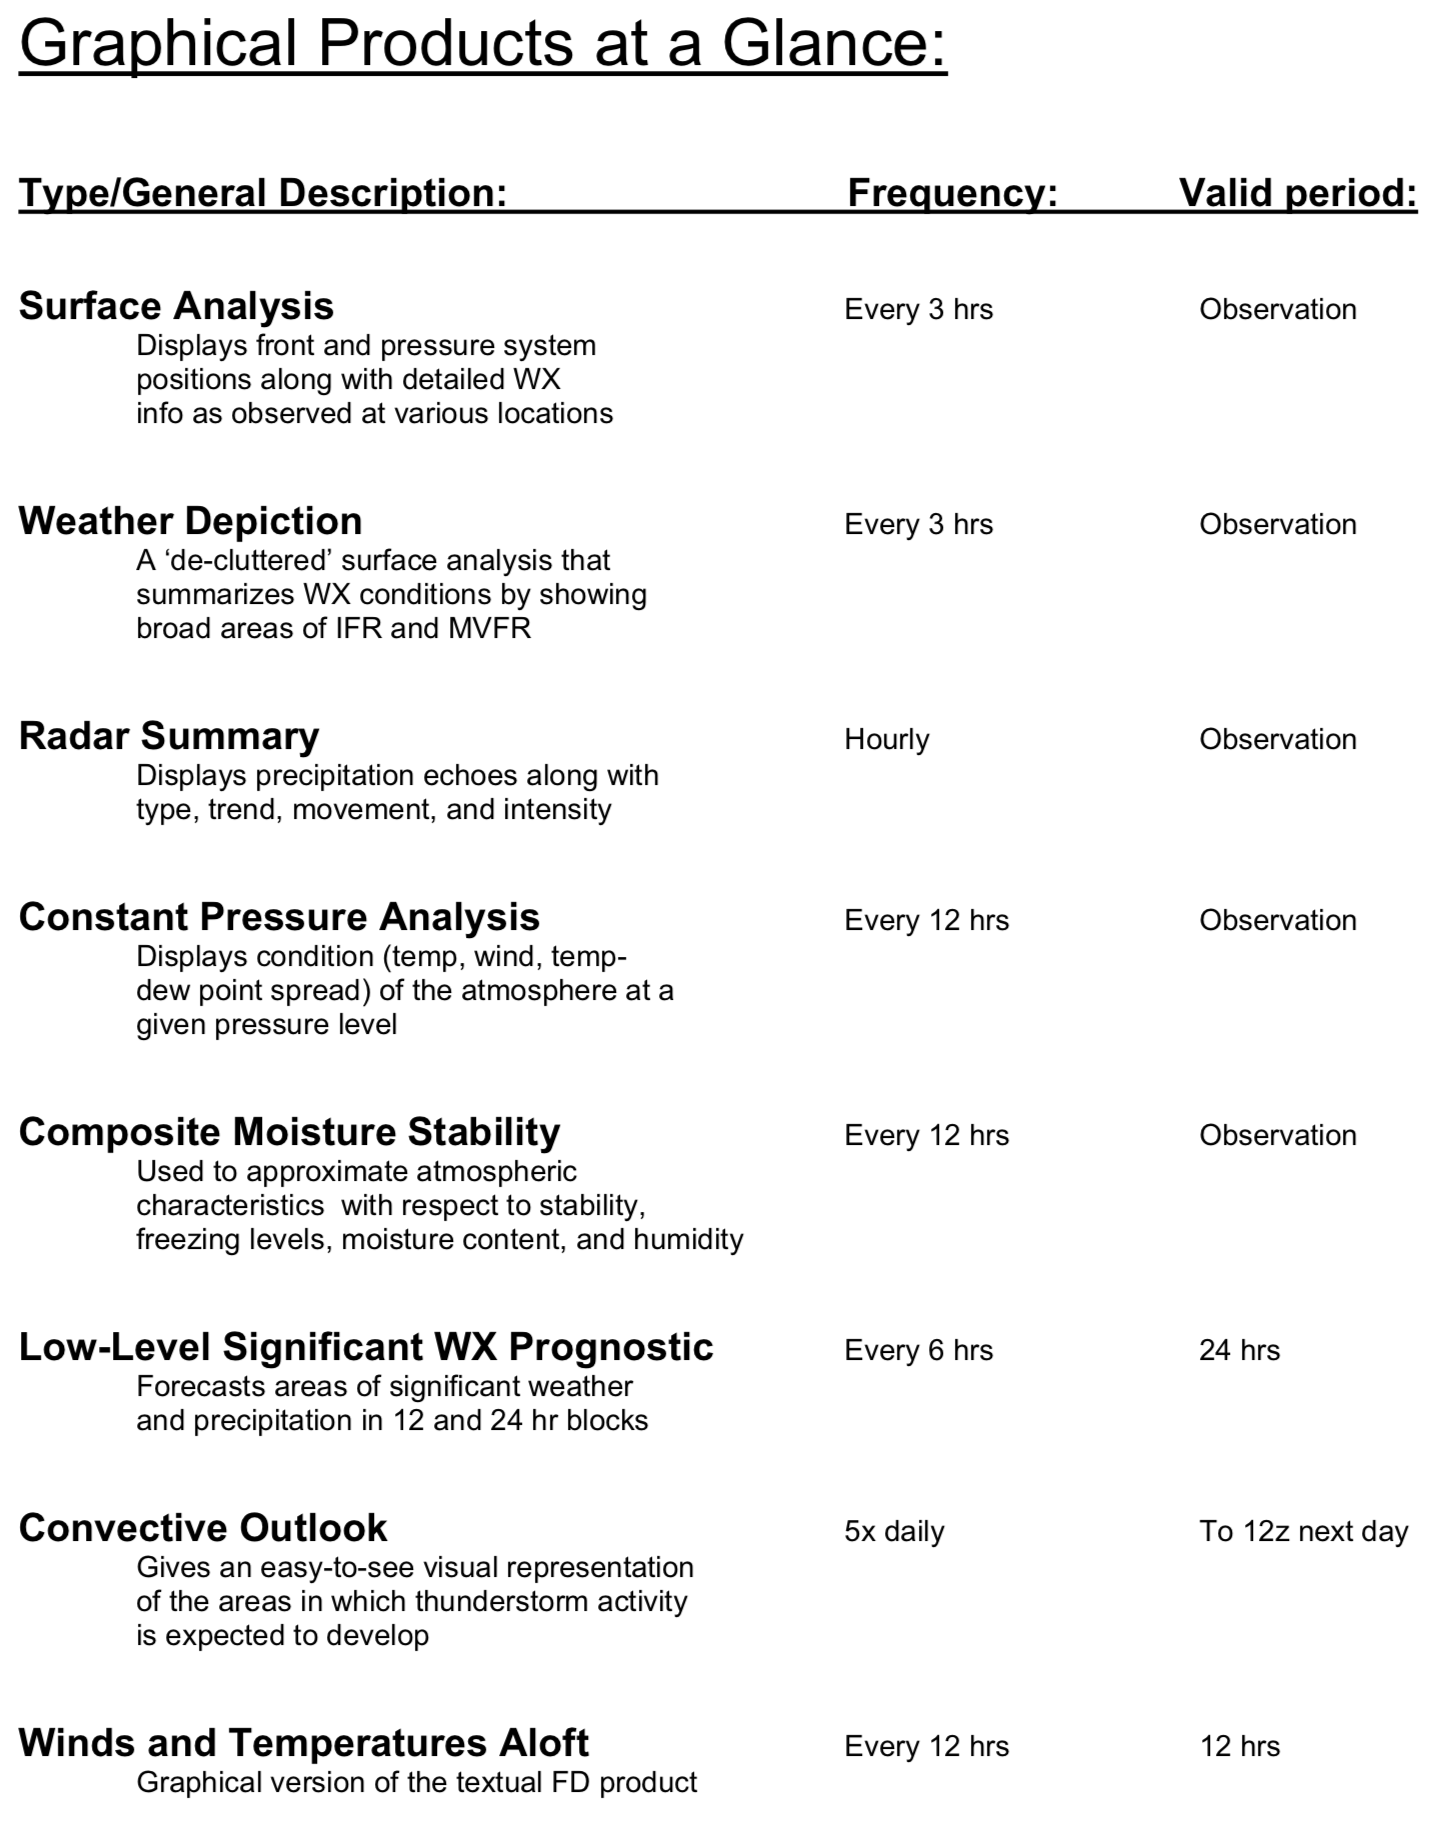
- Note: most graphical products are observations.
- Note: weather products are changing all the time, so the above overview may not be current, but should give a pretty good idea of what is available.
Observations
- See FAA-H-8083-25B Pilot's Handbook of Aeronautical Knowledge Chapter 13: Aviation Weather Services
- Surface observations
- METAR
- Provide local weather conditions and other relevant information for a specific airport
- Equipment
- AWOS - Automated Weather Observing System
- Controlled and operated by the FAA
- Located solely at airports
- Provide near real-time reports
- ASOS - Automated Surface Observing System
- Controlled and operated by National Weather Service (NWS) and Department of Defense (DOD)
- Continuous observations of the weather
- Computer generated voice over phone or radio
- Observations also available textually via weather service
- Collects all information needed to generate a METAR
- Does not report density altitude (recall: density altitude is not part of a METAR report)
- Provides hourly reports
- Example:
KSBYandKOXBhave an ASOS
- AWSS - Automated Weather Sensor System
- METAR
- Upper air observations
- PIREP
- Importance to other pilots (pay it forward)
- Report to FSS, Approach, Tower
- Walk through form (GLS)
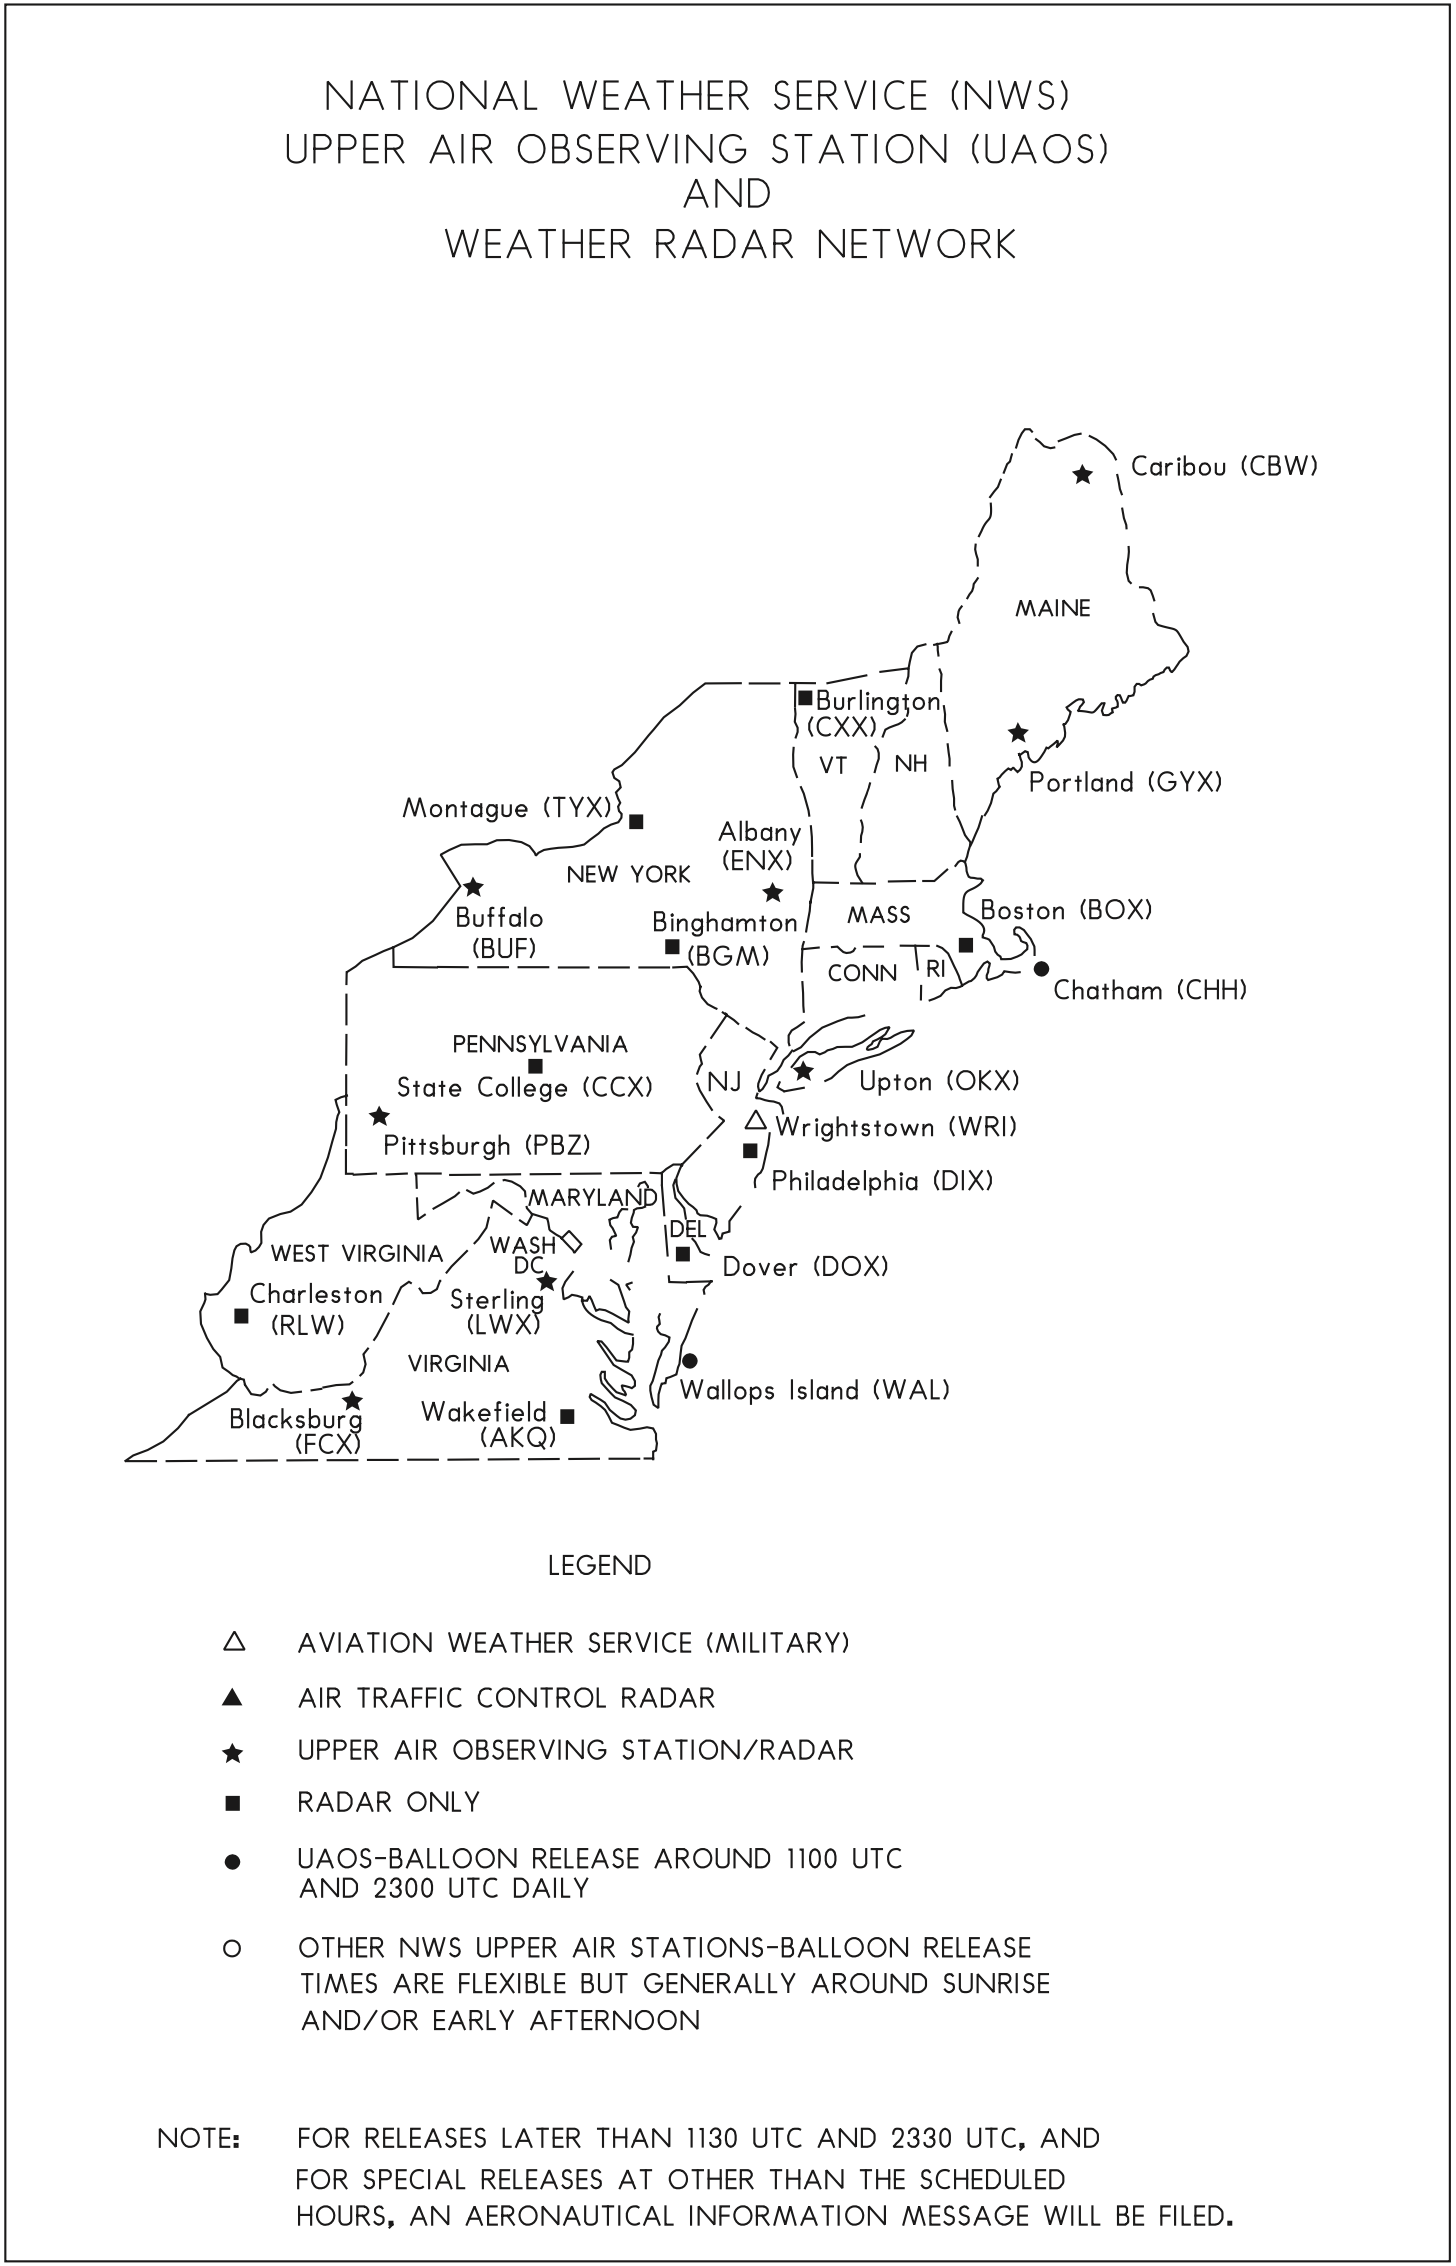
- Weather balloons with radiosonde also used to gather upper air information
- The below are described in PHAK but essentially non-functional - they are not packaged into products that can be readily accessed by pilots
- Aircraft Meteorological Data Relay (AMDAR)
- Uses commercial aircraft to provide automated weather observations
- Captures wind, temperature, humidity/water vapor, turbulence, and icing data
- See amdar.noaa.gov
- Meteorological Data Collection and Reporting System (MDCRS)
- Aircraft Meteorological Data Relay (AMDAR)
- PIREP
- Radar
- Provide information about precipitation and wind
- Four types
- WSR-88D NEXRAD (Doppler)
- Provides radar images in graphical products
- FAA terminal Doppler weather radar (TDWR)
- Installed at some major airports around the country
- Provides severe weather alerts and warnings to ATC
- Ensures pilots are aware of wind shear, gust fronts, and heavy precipitation
- Surveillance Radar
- Primarily to detect aircraft, but it also detects the location and intensity of precipitation
- Airborne Radar
- Installed onboard aircraft
- WSR-88D NEXRAD (Doppler)
- Satellites
- ATIS
- AIRMET (Sierra, Tango, Zulu)
- SIGMET (Severe icing, severe turbulence, CAT, dust storms, volcanic ash)
- Convective SIGMET
Forecasts
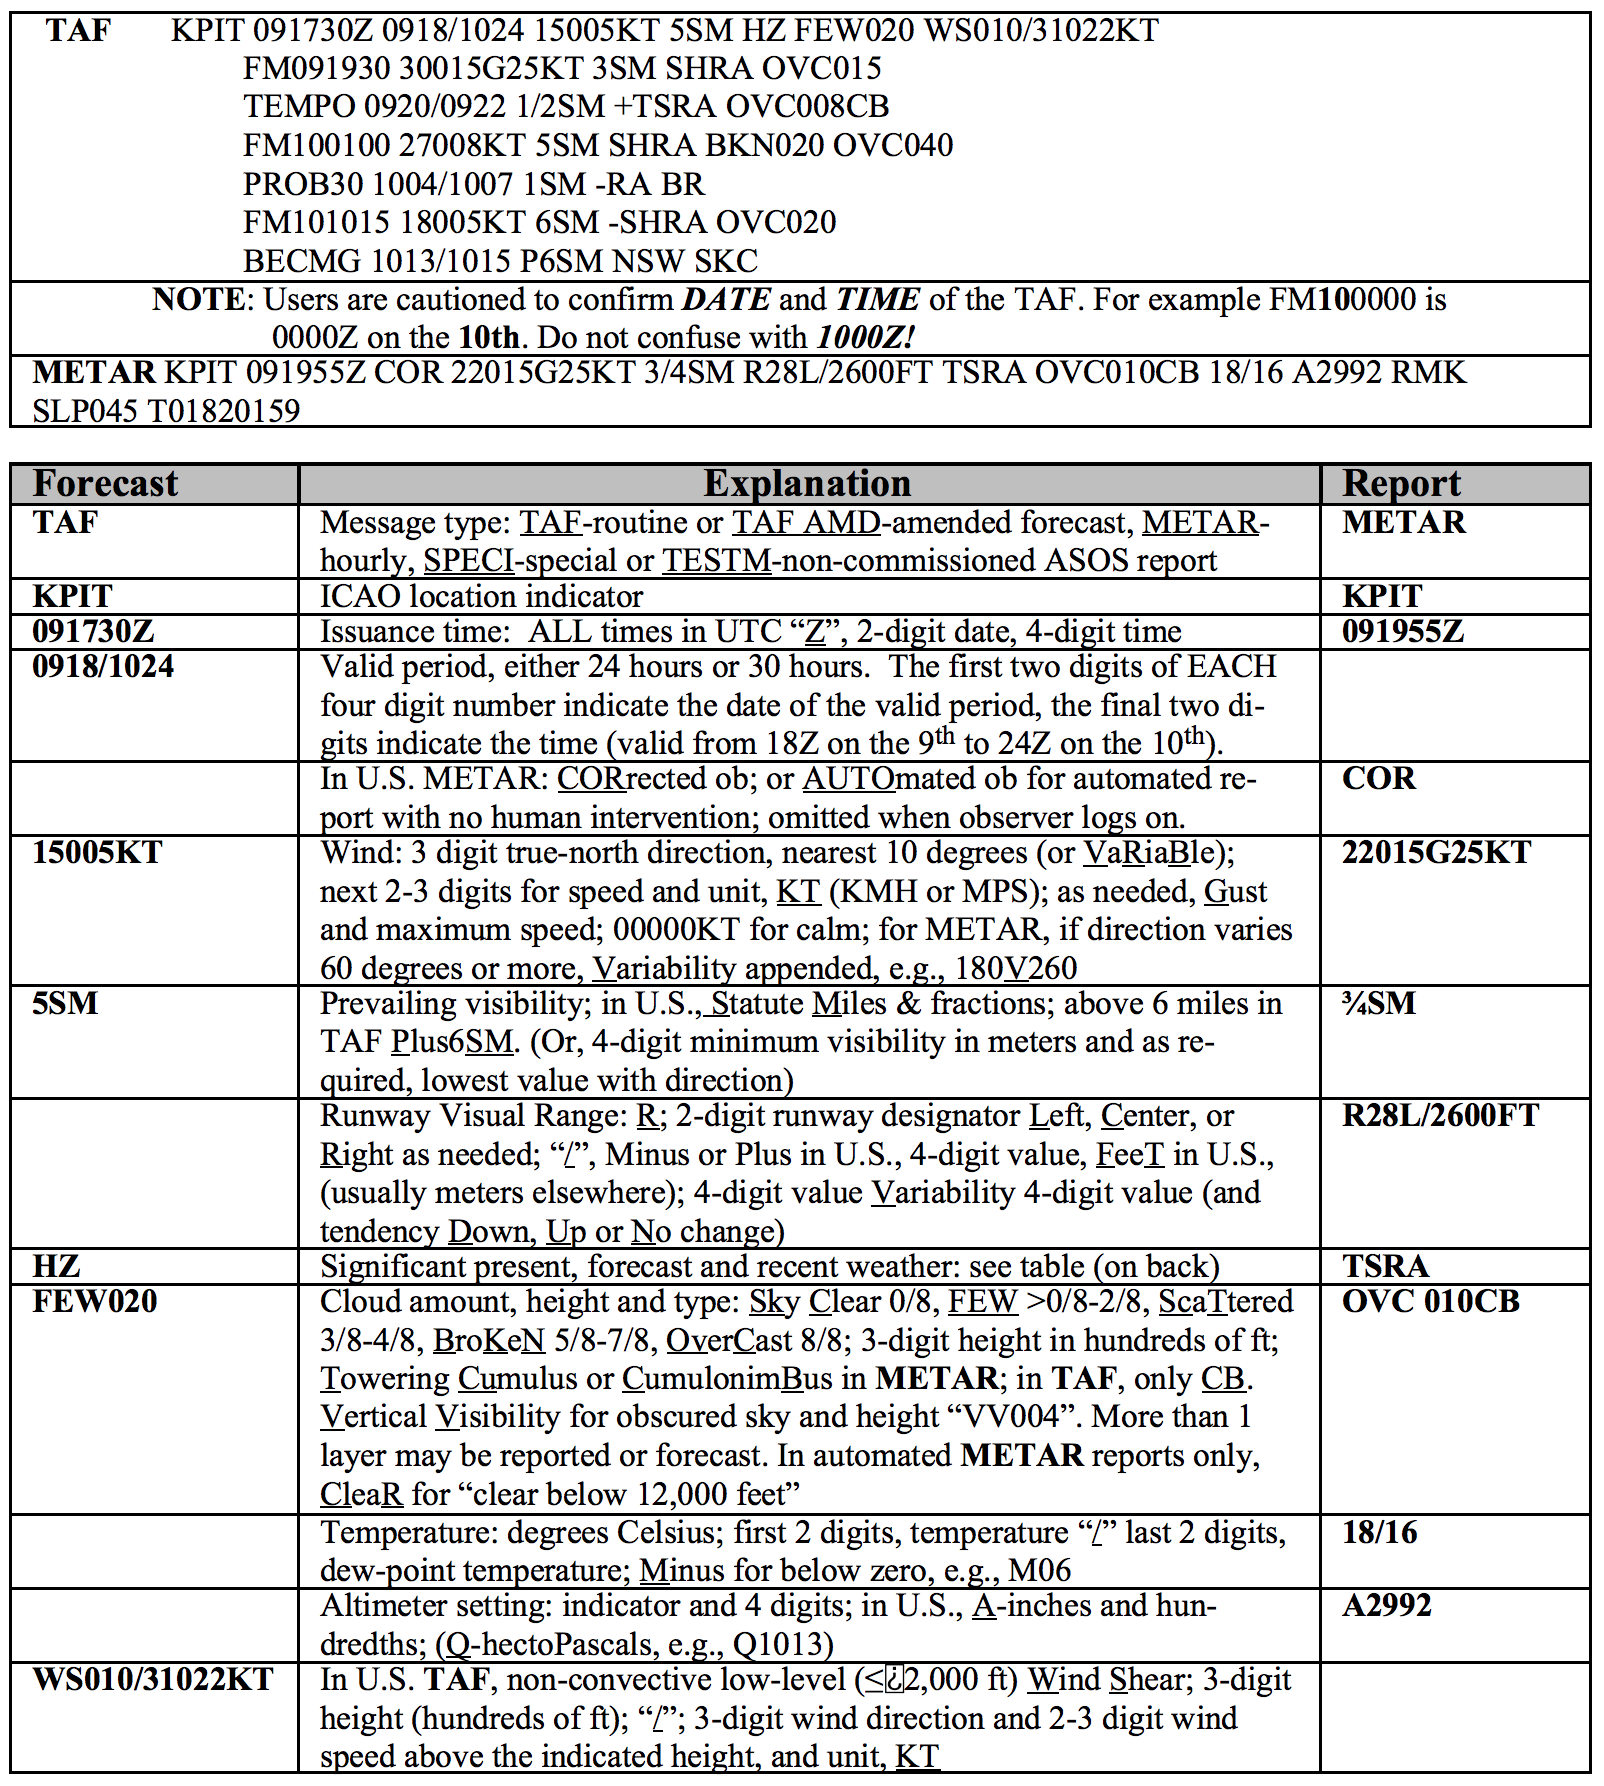
- Terminal Aerodrome Forecasts (TAF)
- 5 nm Radius during 24-hour period
- Slightly different formatting than METAR
- Date/Time of origin (111140Z) – 11th day of month at 11:40Z
- Date/Time of validity (111212) – 11th day of month from 12Z to 12Z following day
- LLWS (WS 3-digit height AGL & element – 020/35035KT)
- Indicators: FM (<1hr change), BECMG (<2 hrs beg/end times), TEMPO
- PROB40 (40% - 50%)
- Area Forecasts (FA)
- Forecast of VMC, clouds, general weather conditions across multiple states
- Previously established symbols
- Issued 3 times per day and valid for 18 hours
- Graphical Forecast for Aviation (GFA)
- Replacing textual Area Forecast (FA)
- Inflight Weather Advisories
- HIWAS
- Discontinued in 2020
- AIRMET
- SIGMET
- Convective SIGMET
- HIWAS
- Winds and Temperatures Aloft Forecast - Graphical (FB)
- Direction, speed, temps
DDVVTT(DDDir,VVVel,TTTemp)- 100-199Kts = -50 from DD, +100 to VV
- Velocity = 99 => Velocity >200KTS
- All temps above FL240 assumed negative
Sources of Weather Data
- NOAA
- National Weather Service
- NWS is a NOAA agency, see NOAA Organization
- The Aviation Weather Center is an NWS center
- National Weather Service
- Flight Service
AWOS, ASOS, and ATIS Reports
Automated Weather Observing System (AWOS)
- Controlled and operated by the FAA
- Located solely at airports
- Provide near real-time reports
- Different types of equipment give different information
Automated Surface Observing System (ASOS)
- Controlled and operated by National Weather Service (NWS) and Department of Defense (DOD)
- Continuous observations of the weather
- Computer generated voice over phone or radio
- Observations also available textually via weather service
- Collects all information needed to generate a METAR
- Does not report density altitude (recall: density altitude is not part of a METAR report)
- Provides hourly reports
- Example:
KSBYandKOXBhave an ASOS - All ASOS give the same information
Automated Weather Sensor System (AWSS)
Automatic Terminal Information Service (ATIS)
- Weather
- Runways in use
- NOTAMs
- Other pertinent information
- Usually recorded 10 minutes before the hour
- Updated on the receipt of any official weather, regardless of content change or reported values
- Default ceiling and visibility if not stated on ATIS is at least 5,000 ft and 5 sm
PATWAS and TIBS
- Telephone Information Briefing Service (TIBS)
- Provided by flight service includes continuous recording of meteorological and/or aeronautical information available by telephone.
- Pilots Automatic Telephone Weather Answering Service (PATWAS)
- Seems to be discontinued, no information in any of the FAA handbooks
TWEB
- Transcribed Weather Broadcast (TWEB)
- Alaska only
- A continuous automated broadcast of meteorological and aeronautical data over selected low or medium frequency (L/ MF) and very high frequency (VHF) omnidirectional range (VOR) NAVAID facilities.
METAR
- METAR
- Meteorological Terminal Aviation Routine Weather Report
- Meteorological Aerodrome Report
- Provide local weather conditions and other relevant information for a specific airport
- Issued every hour or when a significant change to the weather occurs
- Genereated from
- Automated Weather Observing Systems (AWOS)
- Automated Surface Observing Systems (ASOS)
- Type
- Hourly routine
- SPECI - special report that can be given at any time to update the METAR for rapidly changing weather conditions, aircraft mishaps, or other critical information
- Aviation Weather Center: METARs & TAFs
Decoding
- Vertical visibility constitutes a ceiling when there is obscuration
- For example
VV600on METAR would correspond to a ceiling of 600 feet
- For example
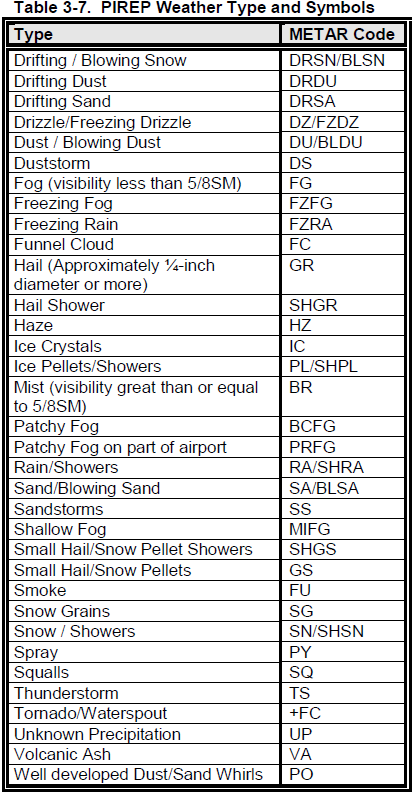
- Fog (
FG)can only be reported if visibility is less than 5/8 mile- If the visibility is 5/8 mile or more up to 6 miles, it can be reported as
BRfor mist
- If the visibility is 5/8 mile or more up to 6 miles, it can be reported as
- Negative temperatures indicated with leading
Mfor minus - There is no format to report partial obscurations
- But using
FEW000,SCT000, orBKN000as examples is when bases are below 50 feet
- But using
- When METAR countains
AUTOit means there was no human intervention to augment the report with information like thunderstorms in vicinity - Dollar sign
$at the end of METAR indicates system that generated it may be in need of maintenance AO1- Thinks any precipitation is rain
AO2- Can tell the difference between types of precipitation
PRESRR- Pressure rising rapidly
- When pressure is rising or falling rapidly it means winds will be strong
LTGIC- Lightning in cloud
LTGCC- Lightning cloud to cloud
LTGCG- Lightning cloud to ground
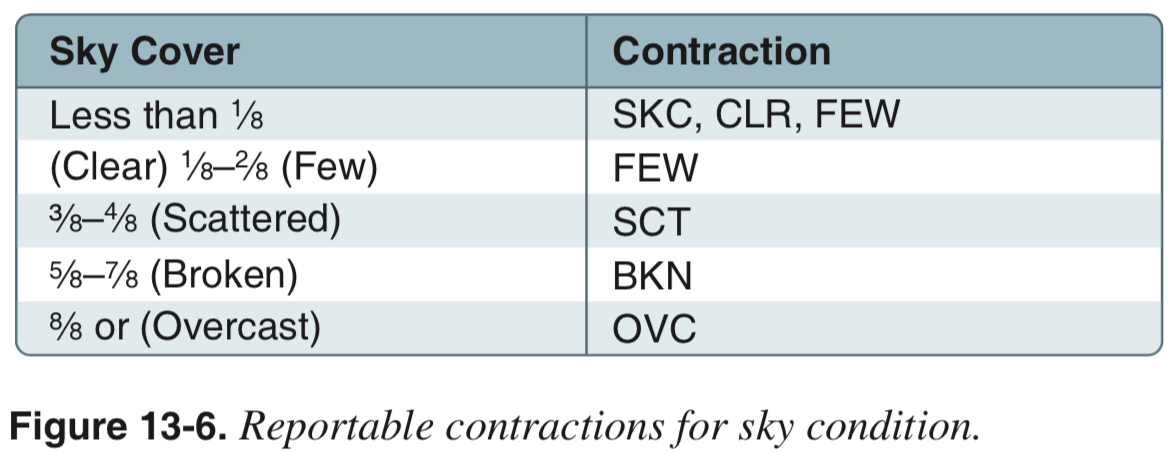
Ceiling
Ceiling is the lowest layer of clouds or obscuring phenomenon that is reported as "broken," "overcast," or "obscuration"
From AIM 7−1−14 Reporting of Cloud Heights:
a. Ceiling, by definition in the CFRs and as used in aviation weather reports and forecasts, is the height above ground (or water) level of the lowest layer of clouds or obscuring phenomenon that is reported as "broken," "overcast," or "obscuration,"
Note: in
RMKthe groupSLPXXX- 1 hPa = 1 mb, and- 1013 mb = 29.92 inHg
- 1017 mb = 30.02 inHg
- Sea Level Pressure in mbar
- To get Sea Level Pressure from the
SLPneed to prepend a9or10, to get a value that is closest to 1000 mbar, with a decimal place inserted asXX.X - For example, given
SLP099this would give a pressure of 1009.9 mbar, which converts to 29.82 inHg
From https://www.aviationweather.ws/072_Obscured_or_Partially_Obscured_Sky.php:
When the sky is totally hidden by the surface based phenomena, the ceiling is the vertical visibility from the ground upward into the obscuration.
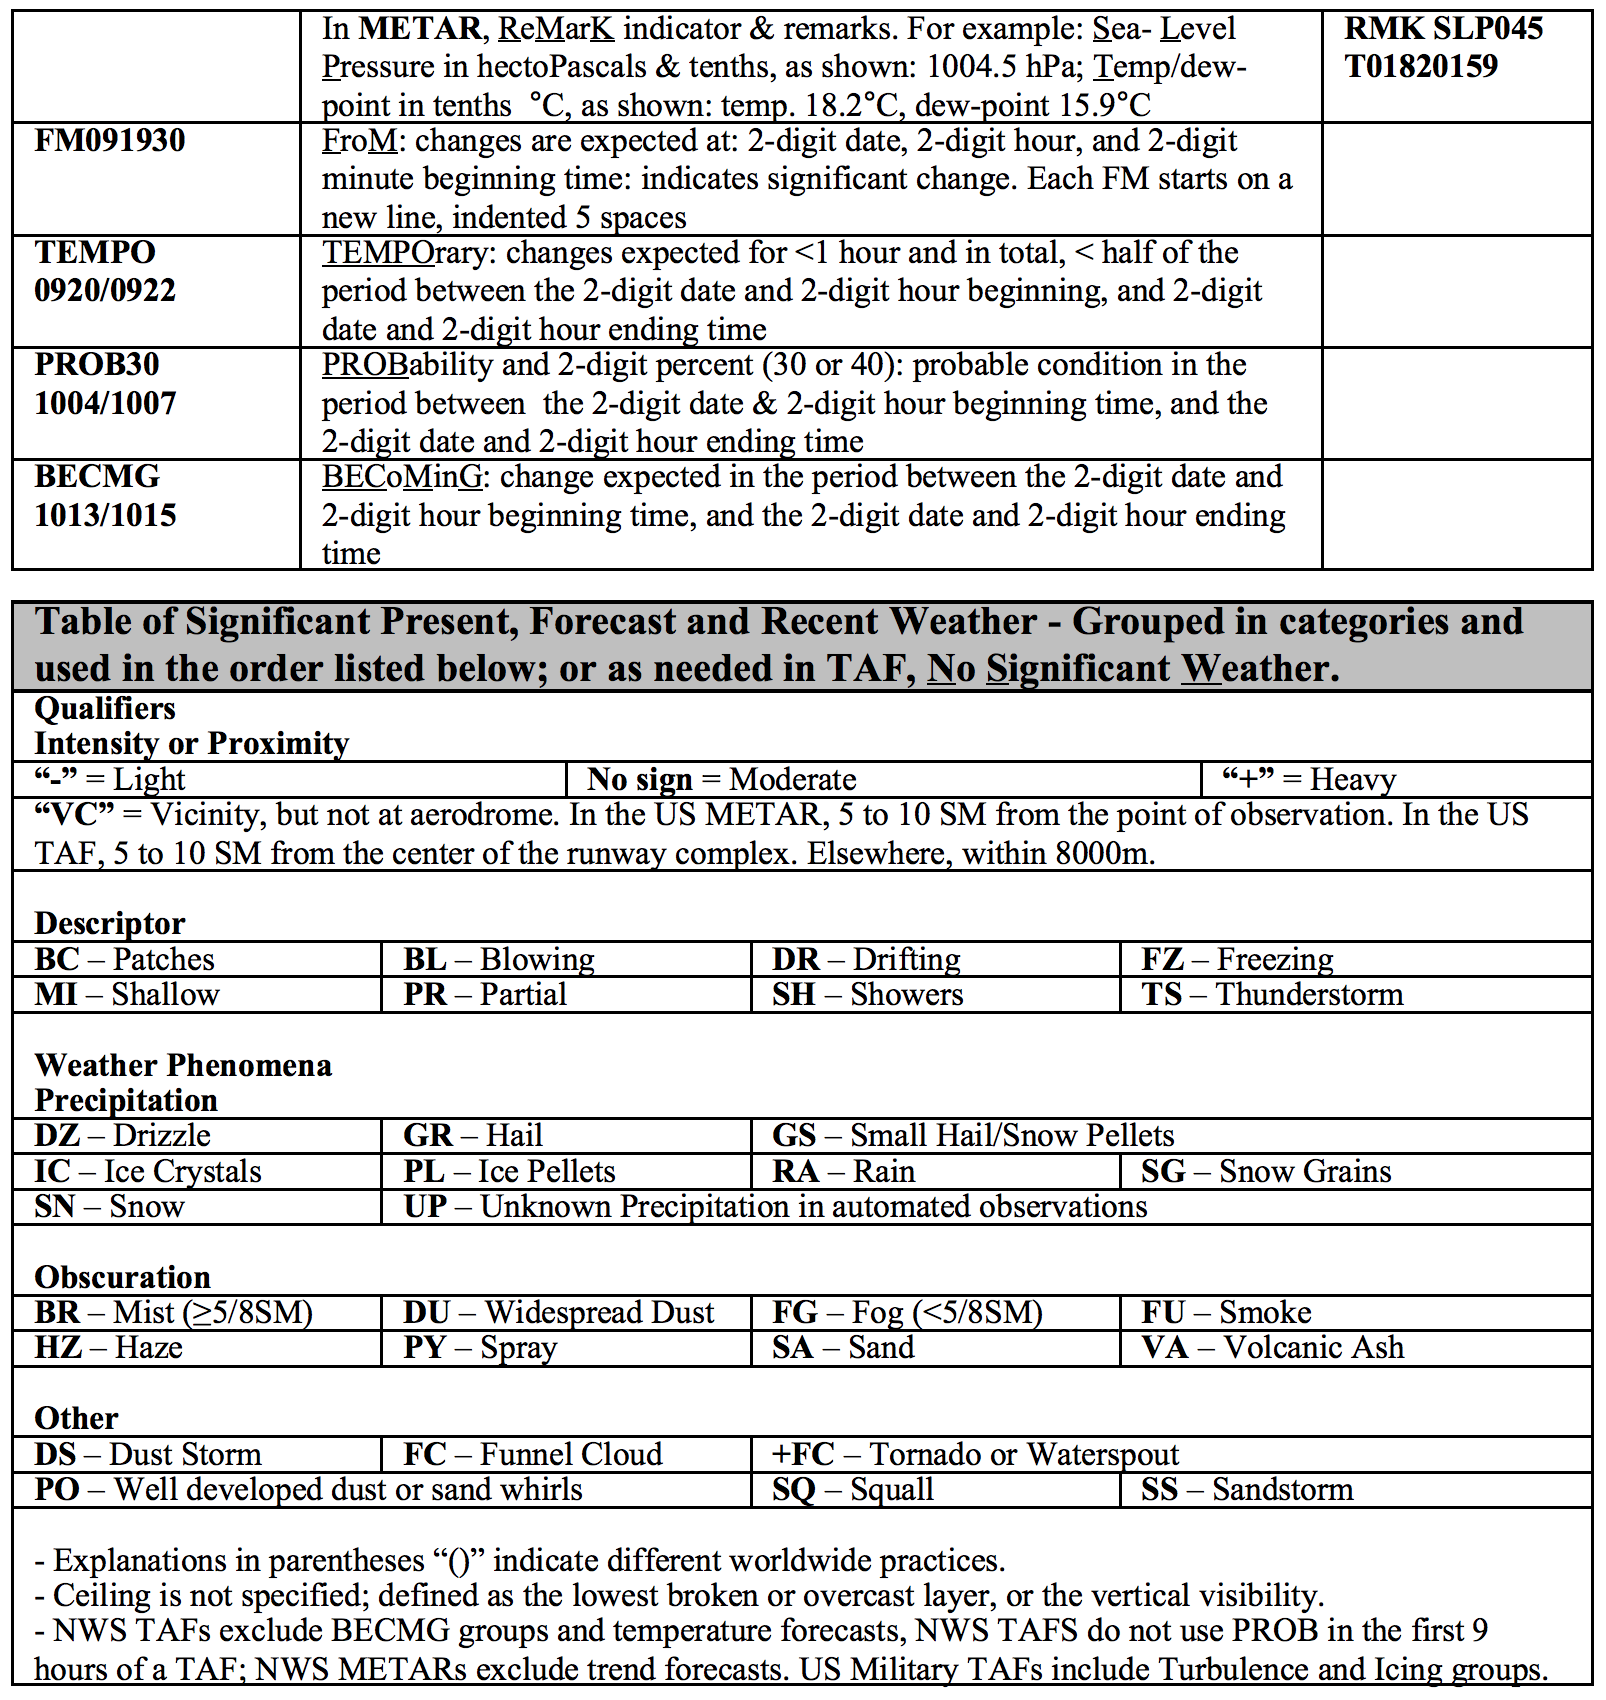
From AIM 7-1-29 International Civil Aviation Organization (ICAO) Weather Formats:
Except for precipitation, phenomena located within 5 statute miles of the point of observation will be reported as at the station. Phenomena between 5 and 10 statute miles will be reported in the vicinity, "VC." Precipitation not occurring at the point of observation but within 10 statute miles is also reported as in the vicinity, "VC." Phenomena beyond 10 statute miles will be shown as distant, "DSNT." Distances are in statute miles except for automated lightning remarks which are in nautical miles.
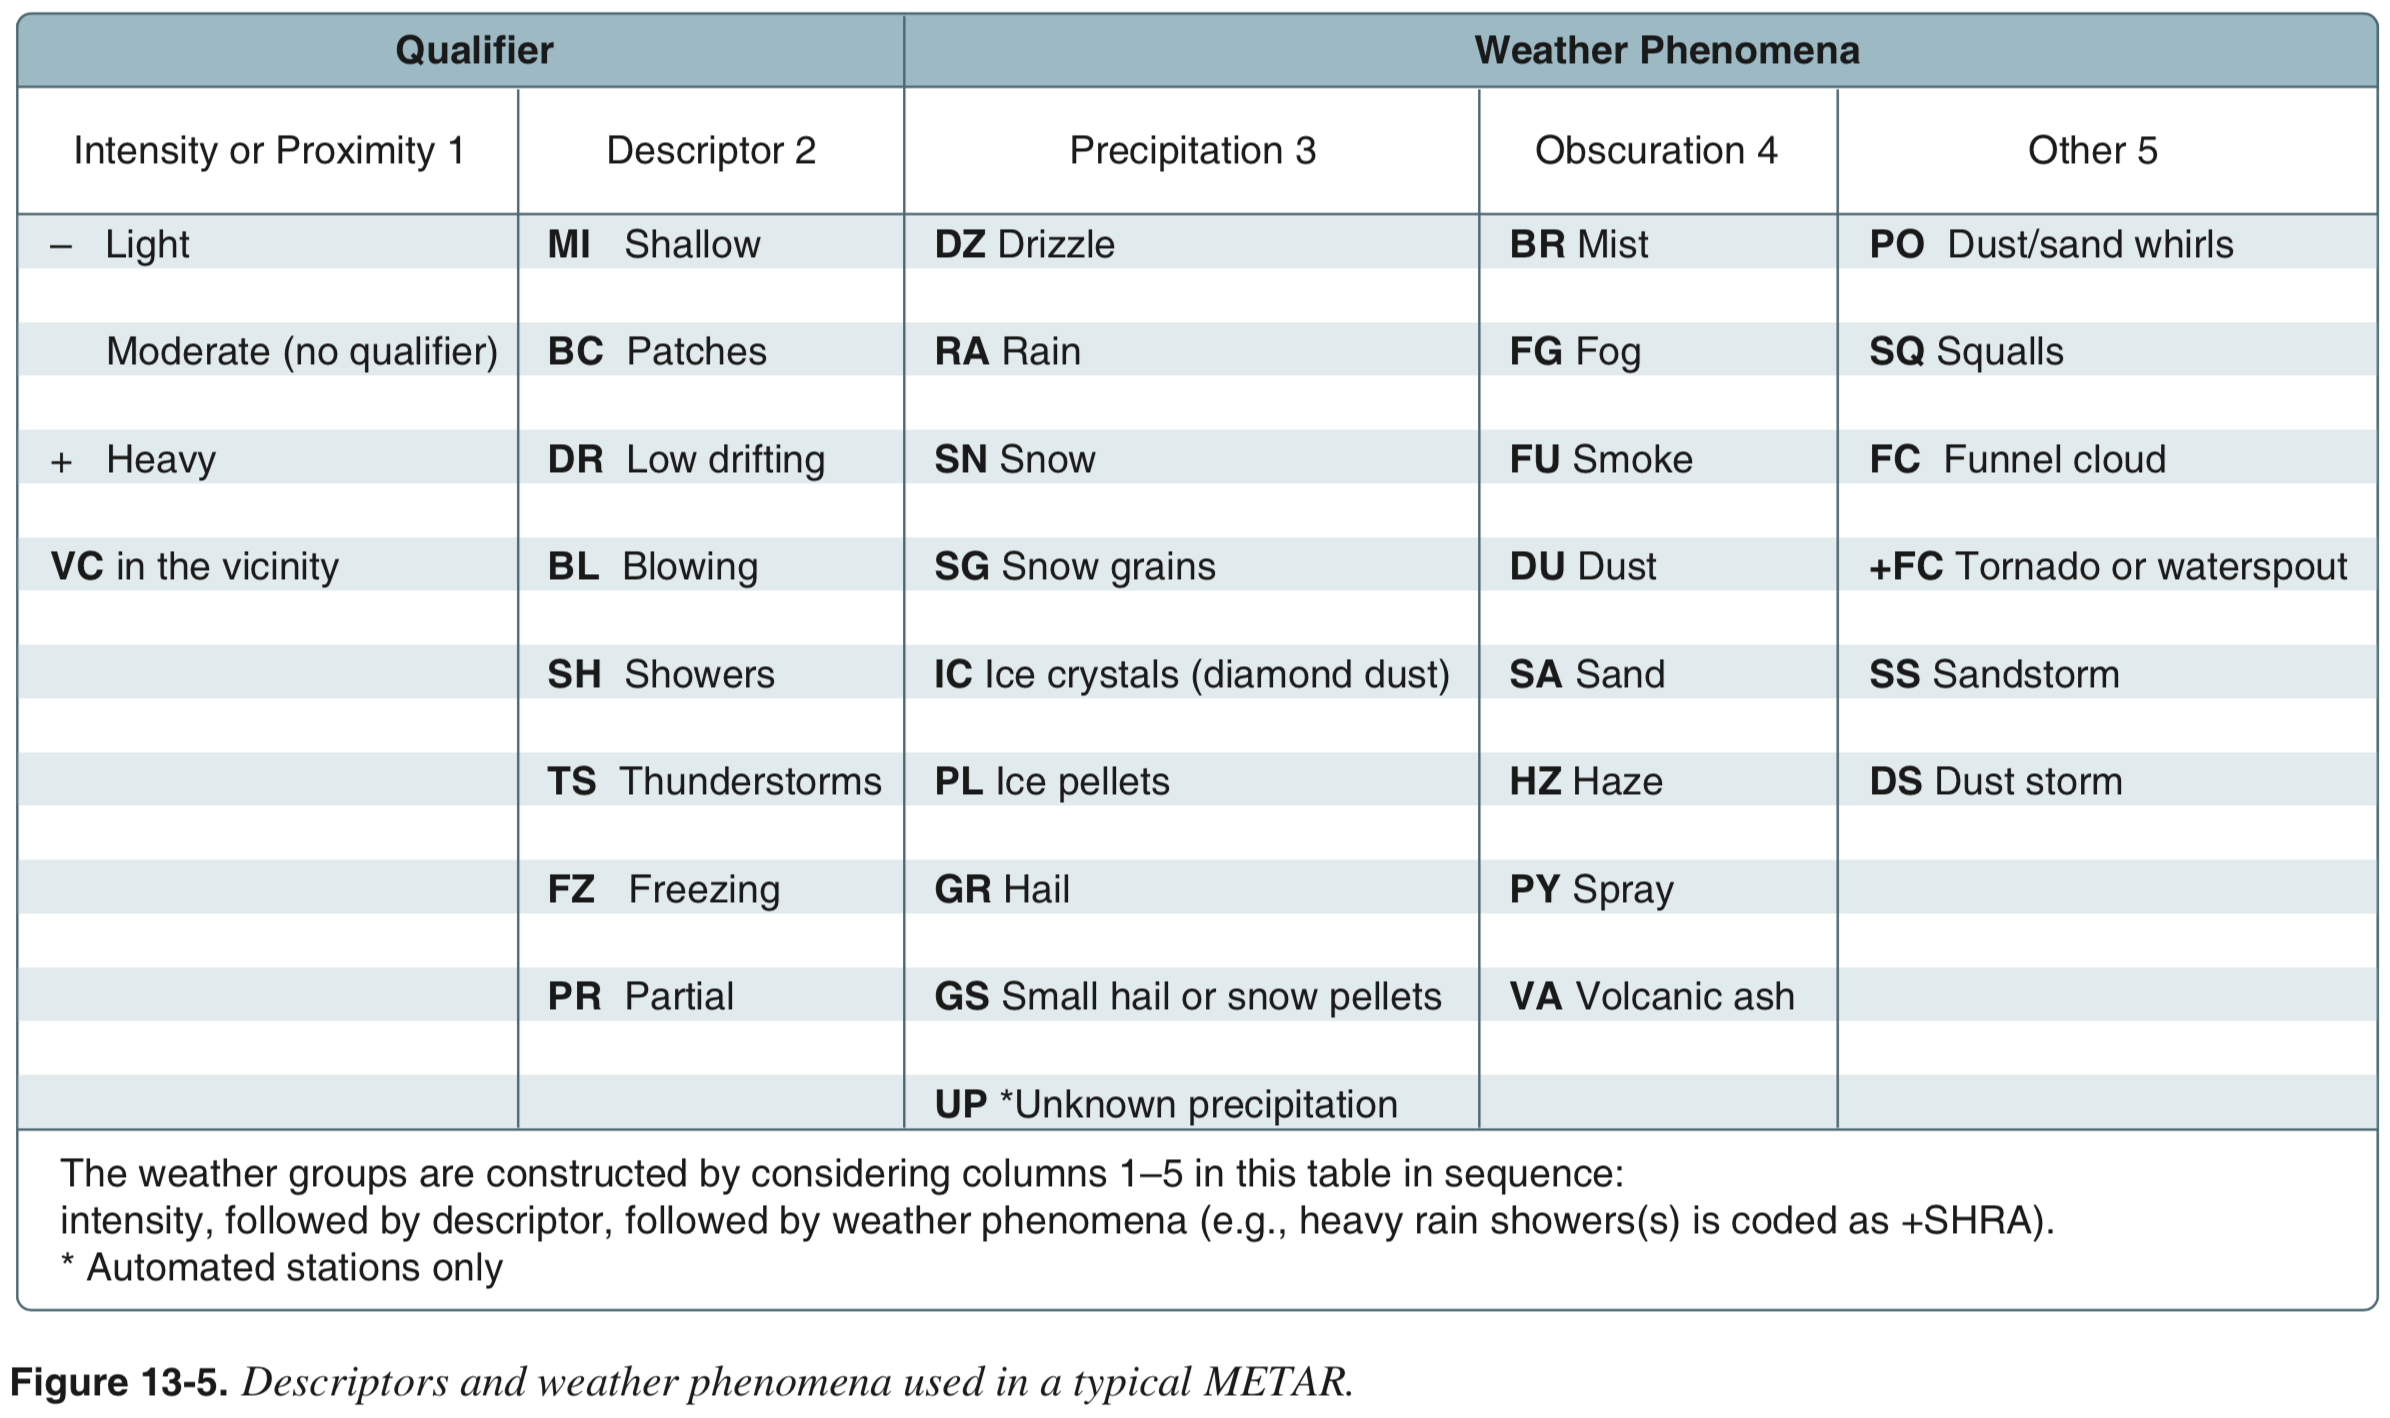
The descriptors
MI(shallow),BC(patches) andPR(partial) are used only in combination with the letter abbreviationFG(fog), e.g.MIFG.The descriptors
DR(drifting) andBL(blowing) are used only in combination withSN(snow),DU(dust) andSA(sand).Drifting is used if the snow, dust or sand is raised less than two metres above ground; if two metres or more, blowing is used.
If blowing snow (
BLSN) and snow (SN) are occurring together, both are reported but in separate w'w' groups, e.g.SN BLSN.SH(shower) is used only in combination with precipitation typesRA(rain),SN(snow),PE(ice pellets),GR(hail) andGS(snow pellets) if occurring at the time of observation, e.g.SHPEor-SHRAGR.TS(thunderstorm) is either reported alone or in combination with one or more of the precipitation types. The end of a thunderstorm is the time at which the last thunder was heard, followed by a 15-minute period with no further thunder.(Note:
TSandSHare not used together, since w'w' groups can have only one descriptor.)FZ(freezing) is used only in combination with the weather typesDZ(drizzle),RA(rain) andFG(fog).
Example 1
KIAD 241952Z 31005KT 1/2SM R01R/2000V2800FT FG VV002 07/06 A2946 RMK
AO2 RAE19 SLP978 P0001 T00670061- METAR
241952Z- Issuance time
31005KT- Winds 310 at 5 knots
1/2SM- Half statute mile visibility
R01R/2000V2800FT- RVR Runway 01R is variable between 2000 and 2800 feet
FG- Fog
VV002- Vertical visibility 200 feet
07/06- Temperature 7 °C, dewpoint 6 °C
A2946- Altimeter setting in inches of mercury
- Remarks
AO2- Automated station without manual augmentation
- Can tell the difference between types of precipitation
RAE19- Rain ended 19 minutes past the hour
SLP978- Sea Level Pressure in mbar
- To get Sea Level Pressure need to prepend a
9or10, to get a value that is closest to 1000 mbar - In this case we prepend
9to get9978or 997.8 mbar - If we prepended a
10the value would be too large
P0001- Hourly precipitation in hundredths of an inch (0.01 inches) since last METAR
T00670061- Hourly temperature 6.7 °C and dewpoint 6.1 °C
- The leading
0of each four digit group indicates the values are positive, a leading1indicates the values are negative
Example 2
KDCA 242036Z 14016KT 4SM RA BR BKN019 BKN047 OVC070 17/15 A2943 RMK
AO2 PRESFR P0004 T01670150- METAR
PRESFR- Pressure falling rapidly
- When pressure is rising or falling rapidly it means winds will be strong
Example 3
KRBD 112153Z 18013G25KT 10SM CLR 12/M03 A2982 RMK AO2 PK WND 19026/2122
SLP099 T01171028
Example 4
SPECI KDAL 041140Z COR 30034G68KT 3/4SM R13L/2800VP6000FT +TSRA BR SQ
FEW011 BKN017 OVC023CB 11/10 A2953 RMK A02 PK WND 29068/1134 WSHFT 1121
TSB10 FRQ LTGICCC ALQDS TS ALQDS MOV NE P0012 T01060100SPECI- Special issuance METAR
KDAL- Dallas Love Field
041140Z- Issuance time
COR- Corrected observation (as opposed to automated)
30034G68KT- Winds
3/4SM- Visibility
R13L/2800VP6000FT- RVR
+TSRA BR SQ- Heavy thunderstorms, rain, squalls
FEW011 BKN017 OVC023CB- Clouds
11/10- Temp and dewpoint in Celcius
A2953- Altimeter setting in inHg
- Remarks
A02- Automated station without manual augmentation
- Can tell the difference between types of precipitation
PK WND 29068/1134- Peak wind 290 at 68 knots that occured at 1134Z
WSHFT 1121- Wind shifted at 1121Z
TSB10- Thunderstorms began 10 minutes past the hour (1110Z)
FRQ LTGICCC ALQDS- Frequent lightning in clouds, cloud-to-cloud, in all quadrants
TS ALQDS MOV NE- Thunderstorms in all quadrants moving northeast
P0012- Hourly precipitation in hundredths of an inch (0.01 inches) since last METAR
T01060100- Hourly temperature 10.6 °C and dewpoint 10.0 °C
- The leading
0of each four digit group indicates the values are positive, a leading1indicates the values are negative
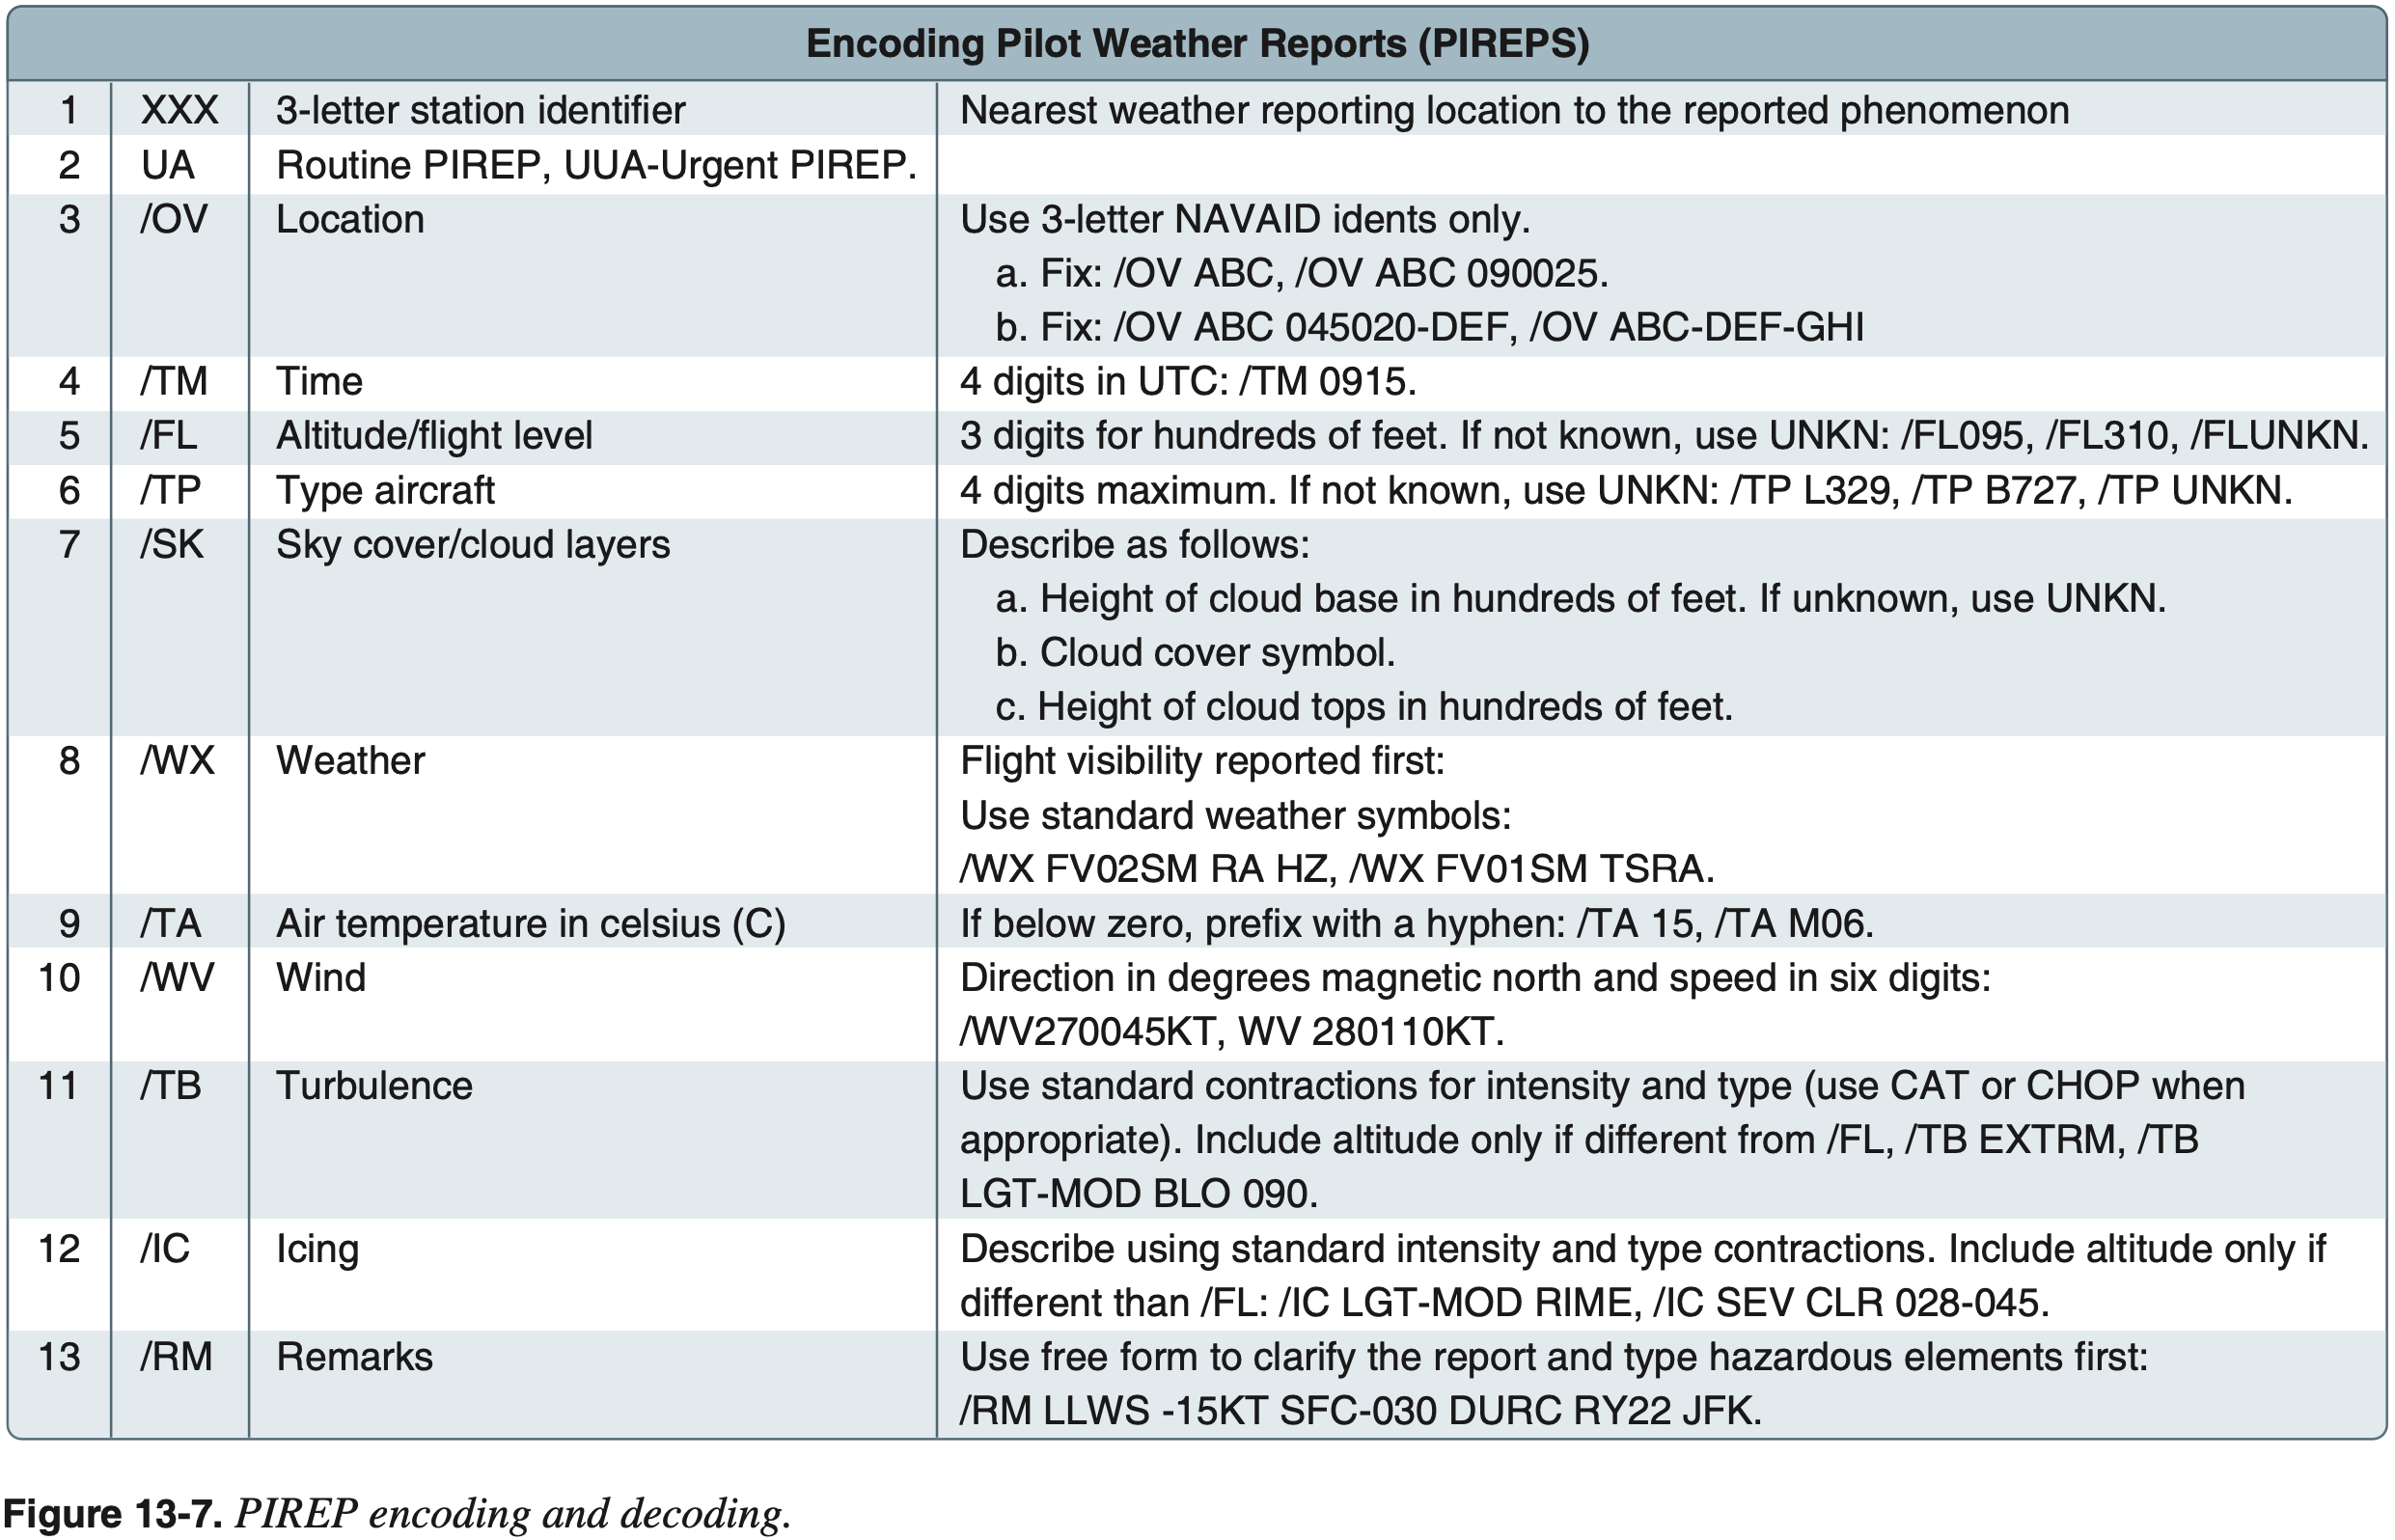
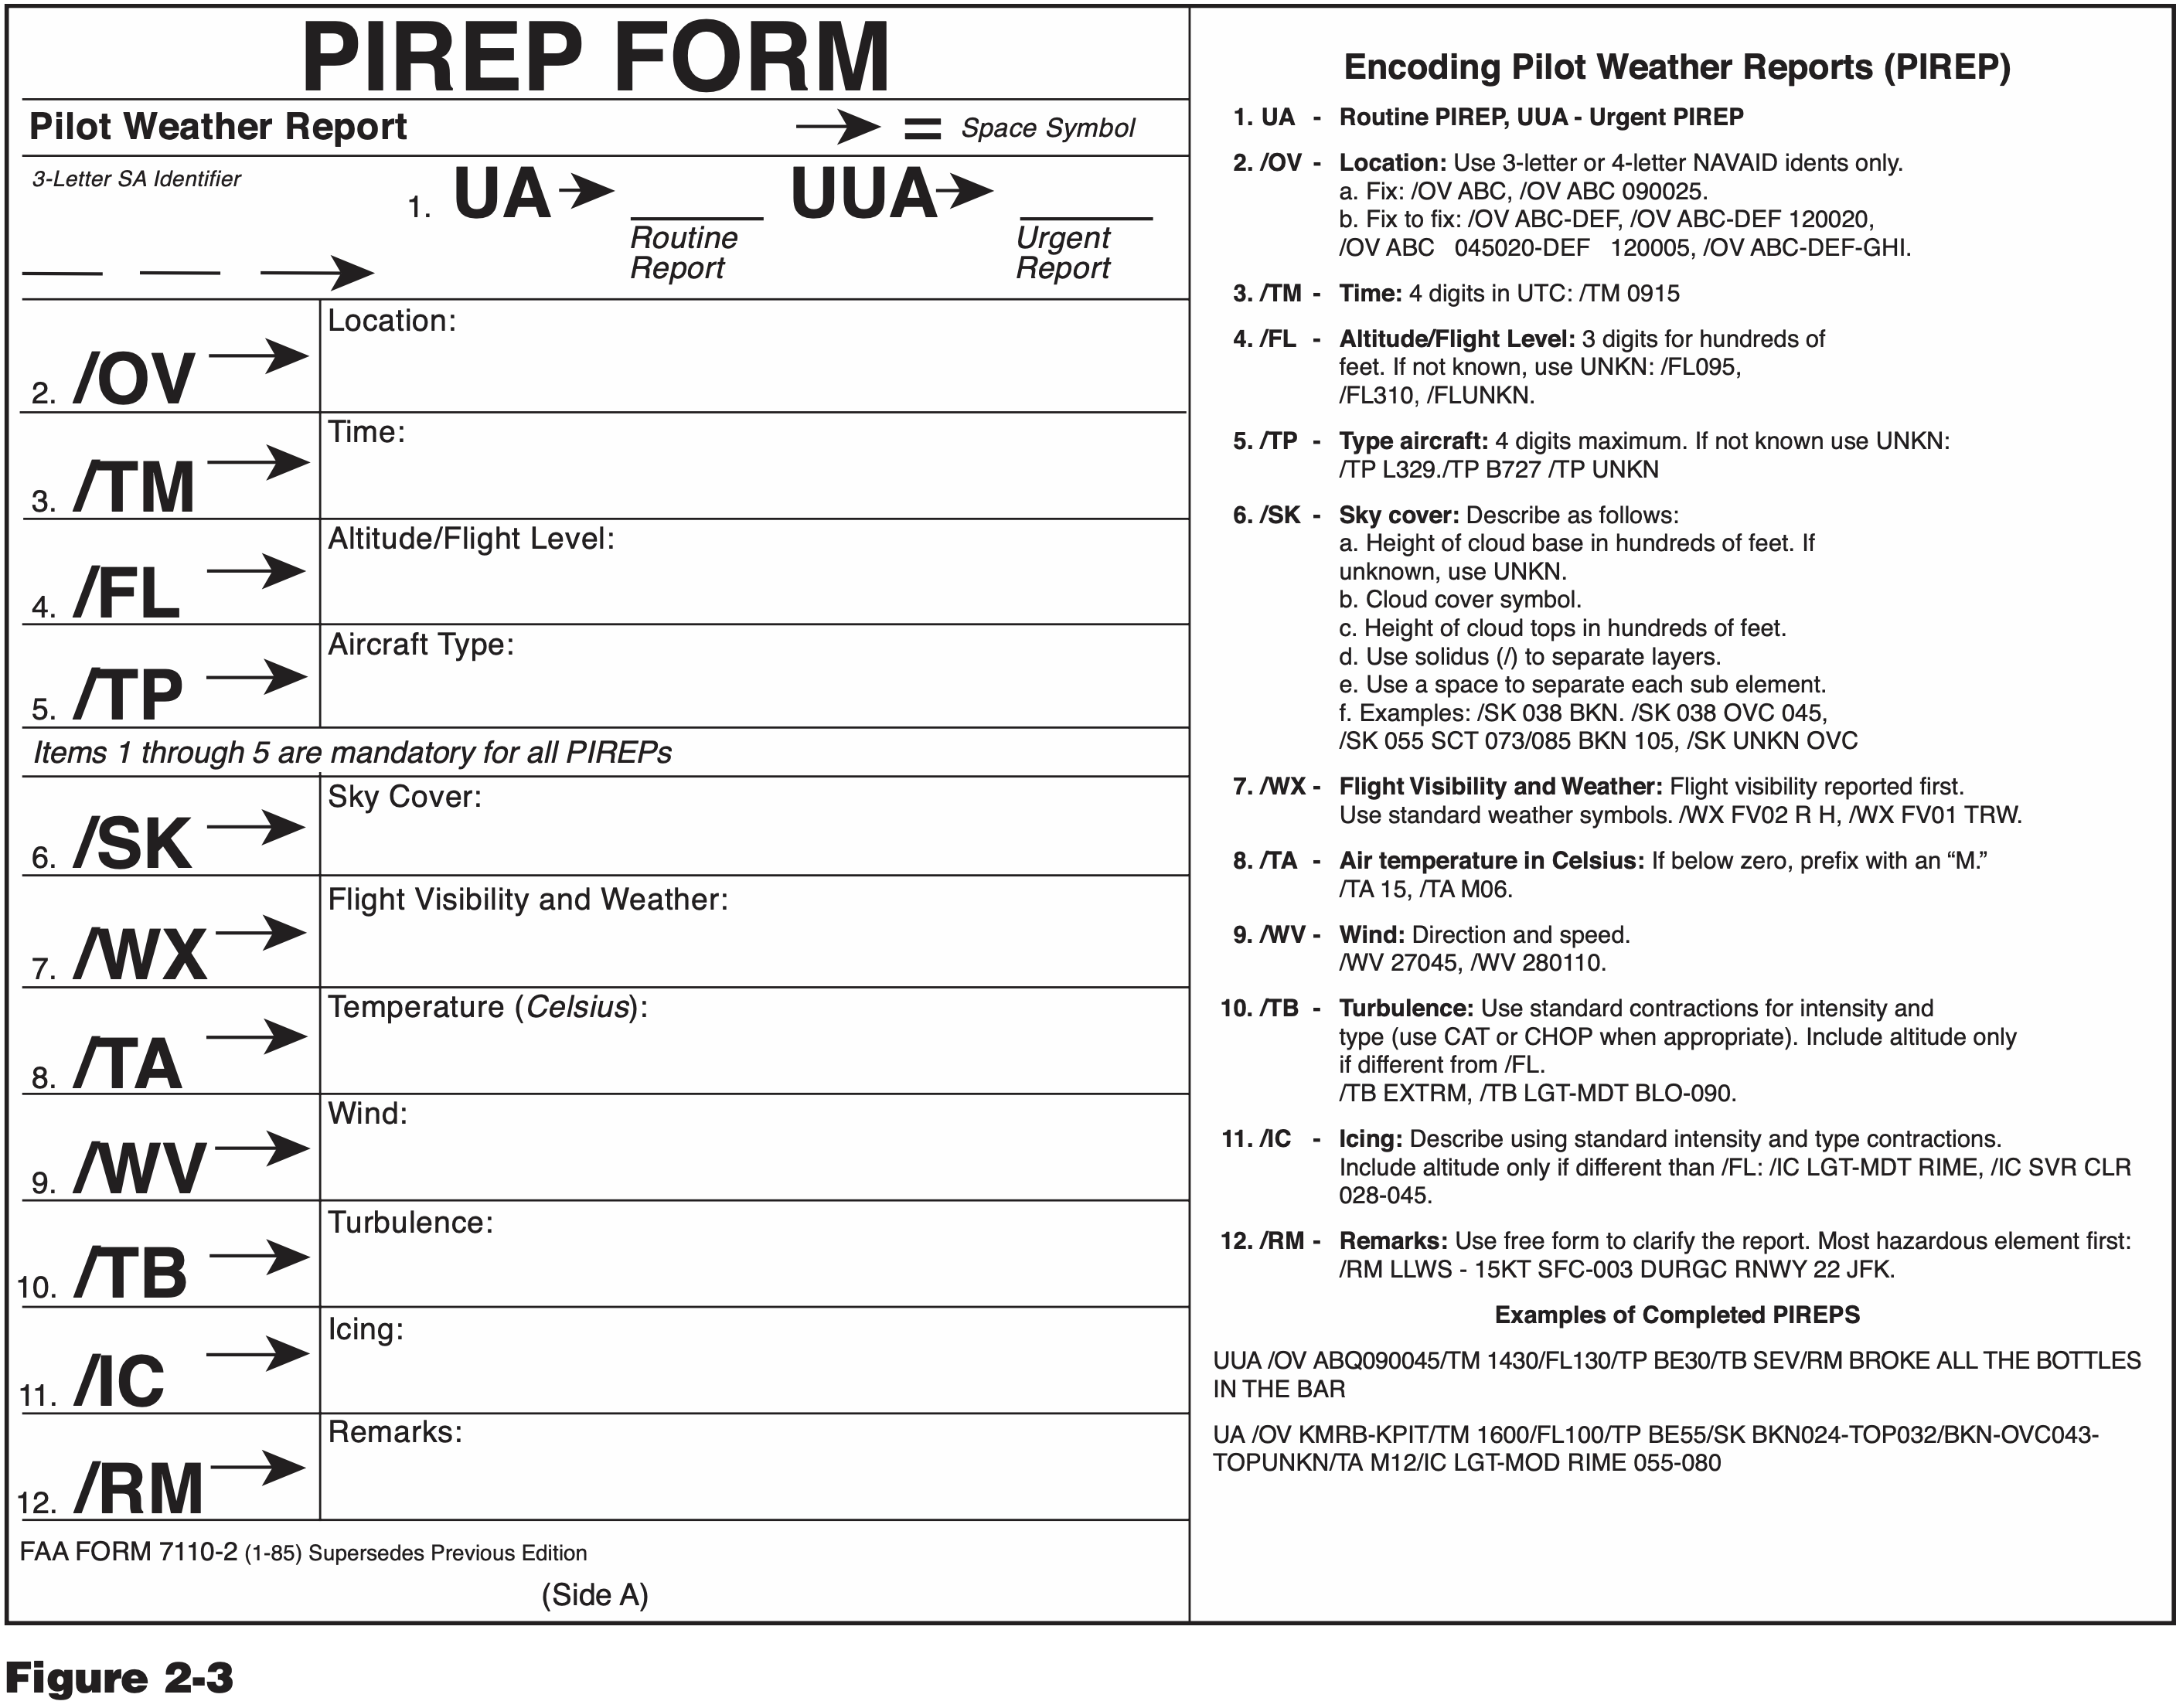
PIREP
- PIREP - Pilot report of observed weather conditions.
- UA - Routine report
- UUA - Urgent repot
- Pilots are pretty good about reporting icing and turbulence
- Good idea when checking in with a controller to state how the ride is
- "Approach Cessna 12345 level 8,000 light chop"
- Most accurate weather report
- When reading a PIREP, each piece of information is within the forward slashes
- Required info for PIREP: location, time, altitude MSL, type of aircraft, weather encountered.
PIREP icing reporting levels
See: AIM 7-1-19 PIREPs Relating to Airframe Icing.
- Trace Icing
- Ice becomes noticeable or perceiptible
- The rate of accumulation is slightly greater than the rate of sublimation
- A representative accretion rate for reference purposes is less than 1/4 inch (6 mm) per hour on the outer wing
- The pilot should consider exiting the icing conditions before they become worse
- Light Icing
- The rate of ice accumulation requires occasional cycling of manual deicing systems to minimize ice accretions on the airframe
- A representative accretion rate for reference purposes is 1/4 inch to 1 inch (0.6 to 2.5 cm) per hour on the unprotected part of the outer wing
- The pilot should consider exiting the icing condition.
- Problem if flight is prolonged more than one hour, no problem if anti-icing equipment used
- Moderate Icing
- The rate of ice accumulation requires frequent cycling of manual deicing systems to minimize ice accretions on the airframe
- A representative accretion rate for reference purposes is 1 to 3 inches (2.5 to 7.5 cm) per hour on the unprotected part of the outer wing
- The pilot should consider exiting the icing condition as soon as possible.
- Short encounters are potentially hazardous; anti-icing or diversion is necessary
- Severe Icing
- The rate of ice accumulation is such that ice protection systems fail to remove the accumulation of ice and ice accumulates in locations not normally prone to icing, such as areas aft of protected surfaces and any other areas identified by the manufacturer
- A representative accretion rate for reference purposes is more than 3 inches (7.5 cm) per hour on the unprotected part of the outer wing
- By regulation, immediate exit is required
- De/anti-icing insufficient to deal with hazard; need immediate diversion
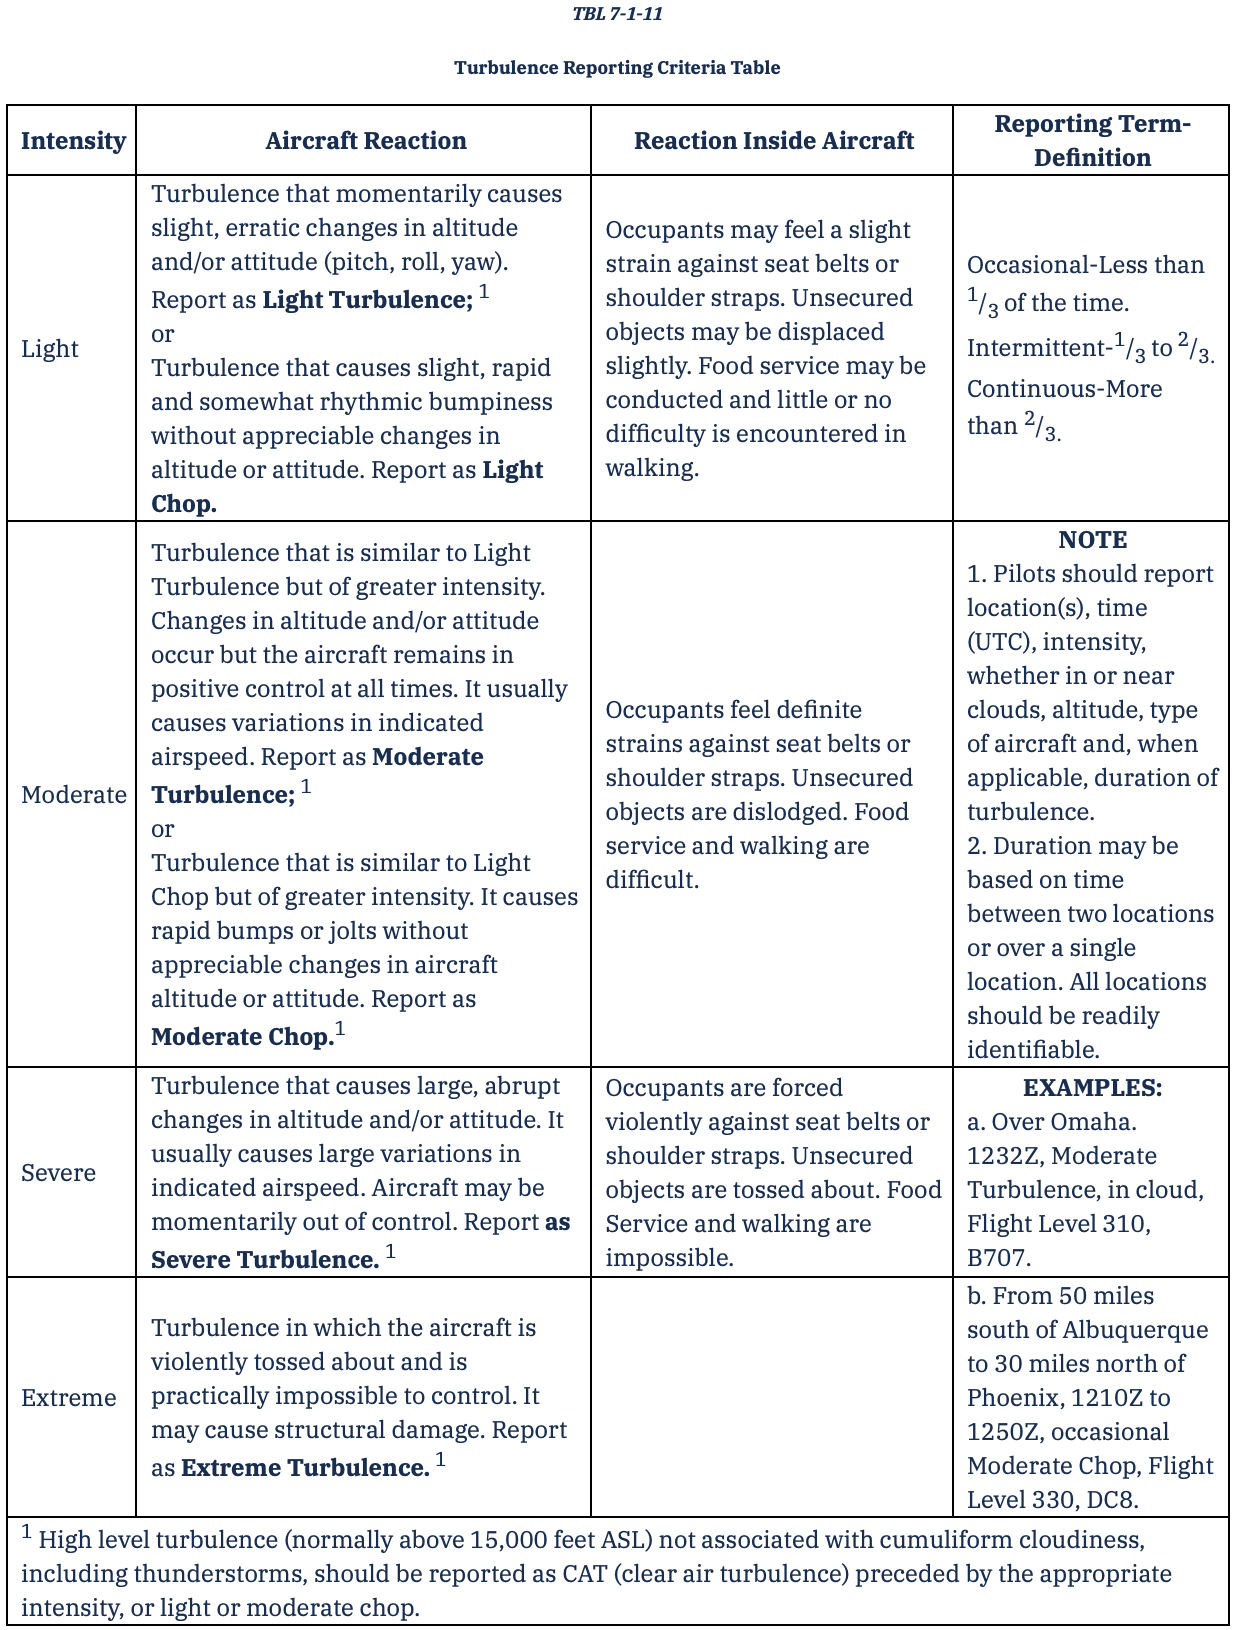
PIREP turbulence reporting levels
See: AIM 7-1-21 PIREPs Relating to Turbulence.
- Light
- Momentary without appreciable changes in altitude or attitude
- Note: keyword is momentary
- Moderate
- Variations in indicated airspeed
- Severe
- Aircraft may be momentarily out of control
- Extreme
- Impossible to control
- Chop
- Rhythmic bumpiness without appreciable changes in altitude or attitude
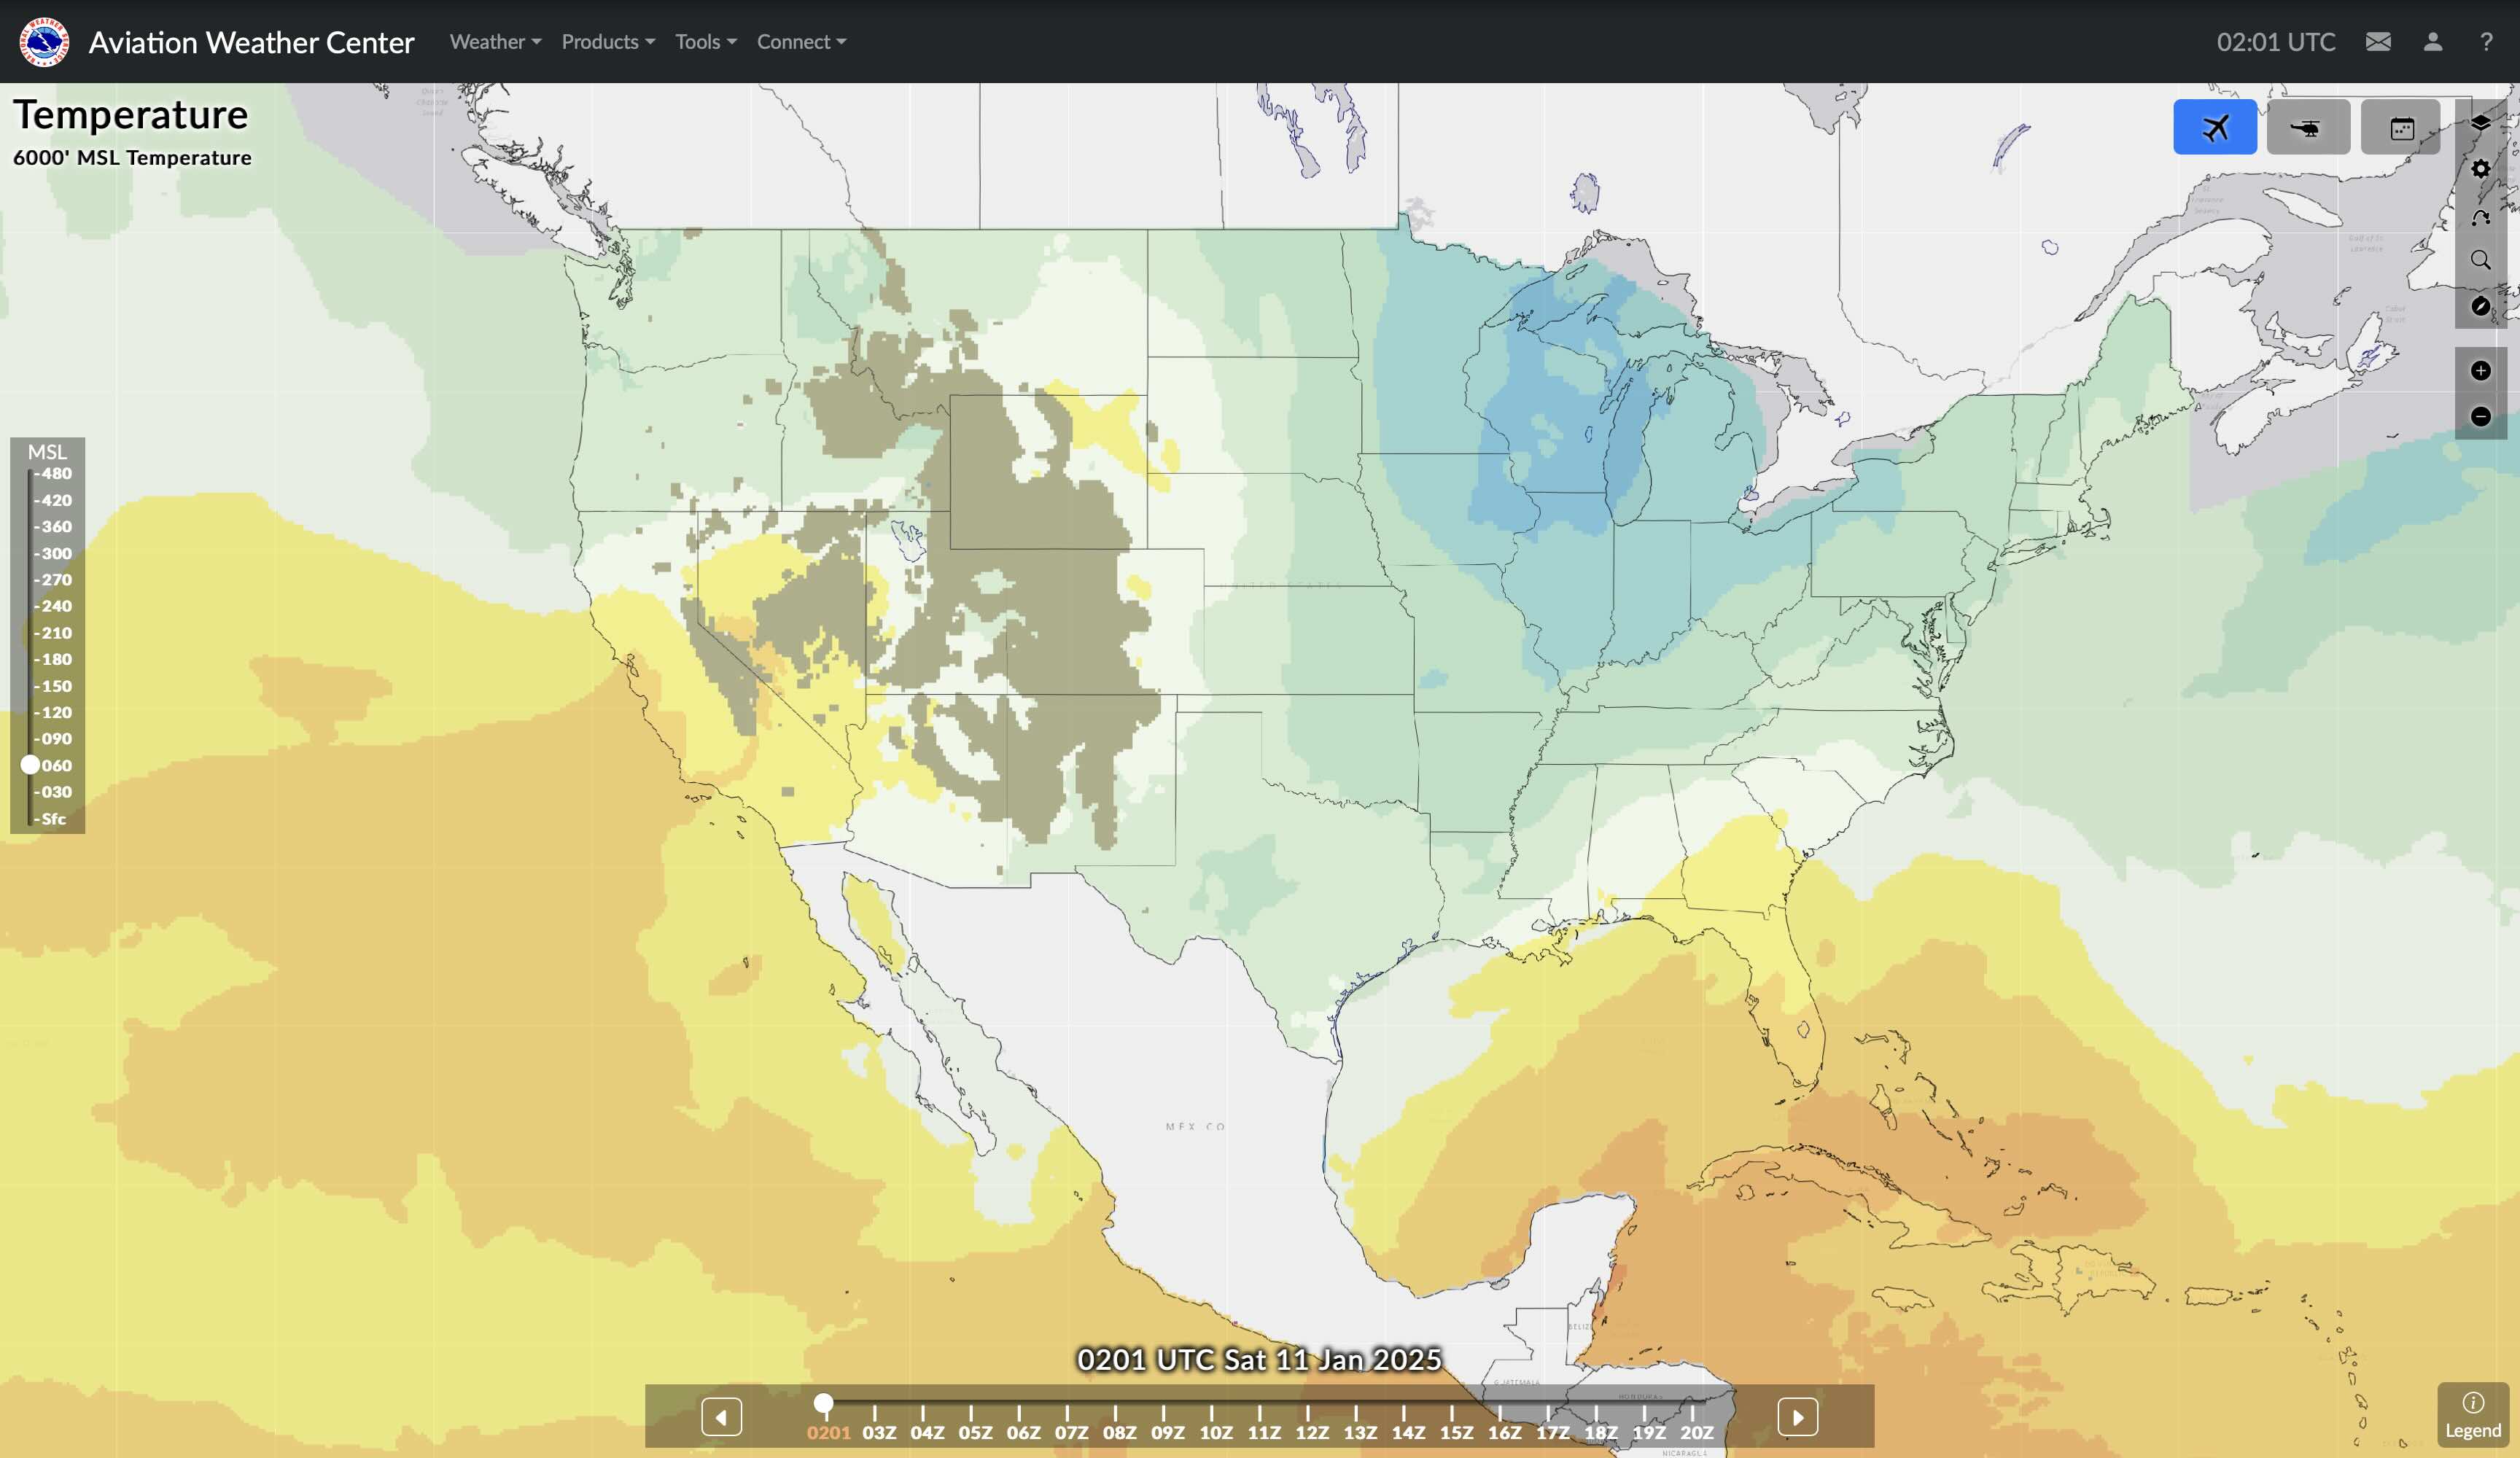
Freezing Level Charts
- See Aviation Weather Center Current Freezing Level Forecast
- Shows forecast freezing level in 100s of feet MSL for a given forecast window
- It shows the current freezing level
- Also shows forecast in windows of 1 hour up to 18 hours out
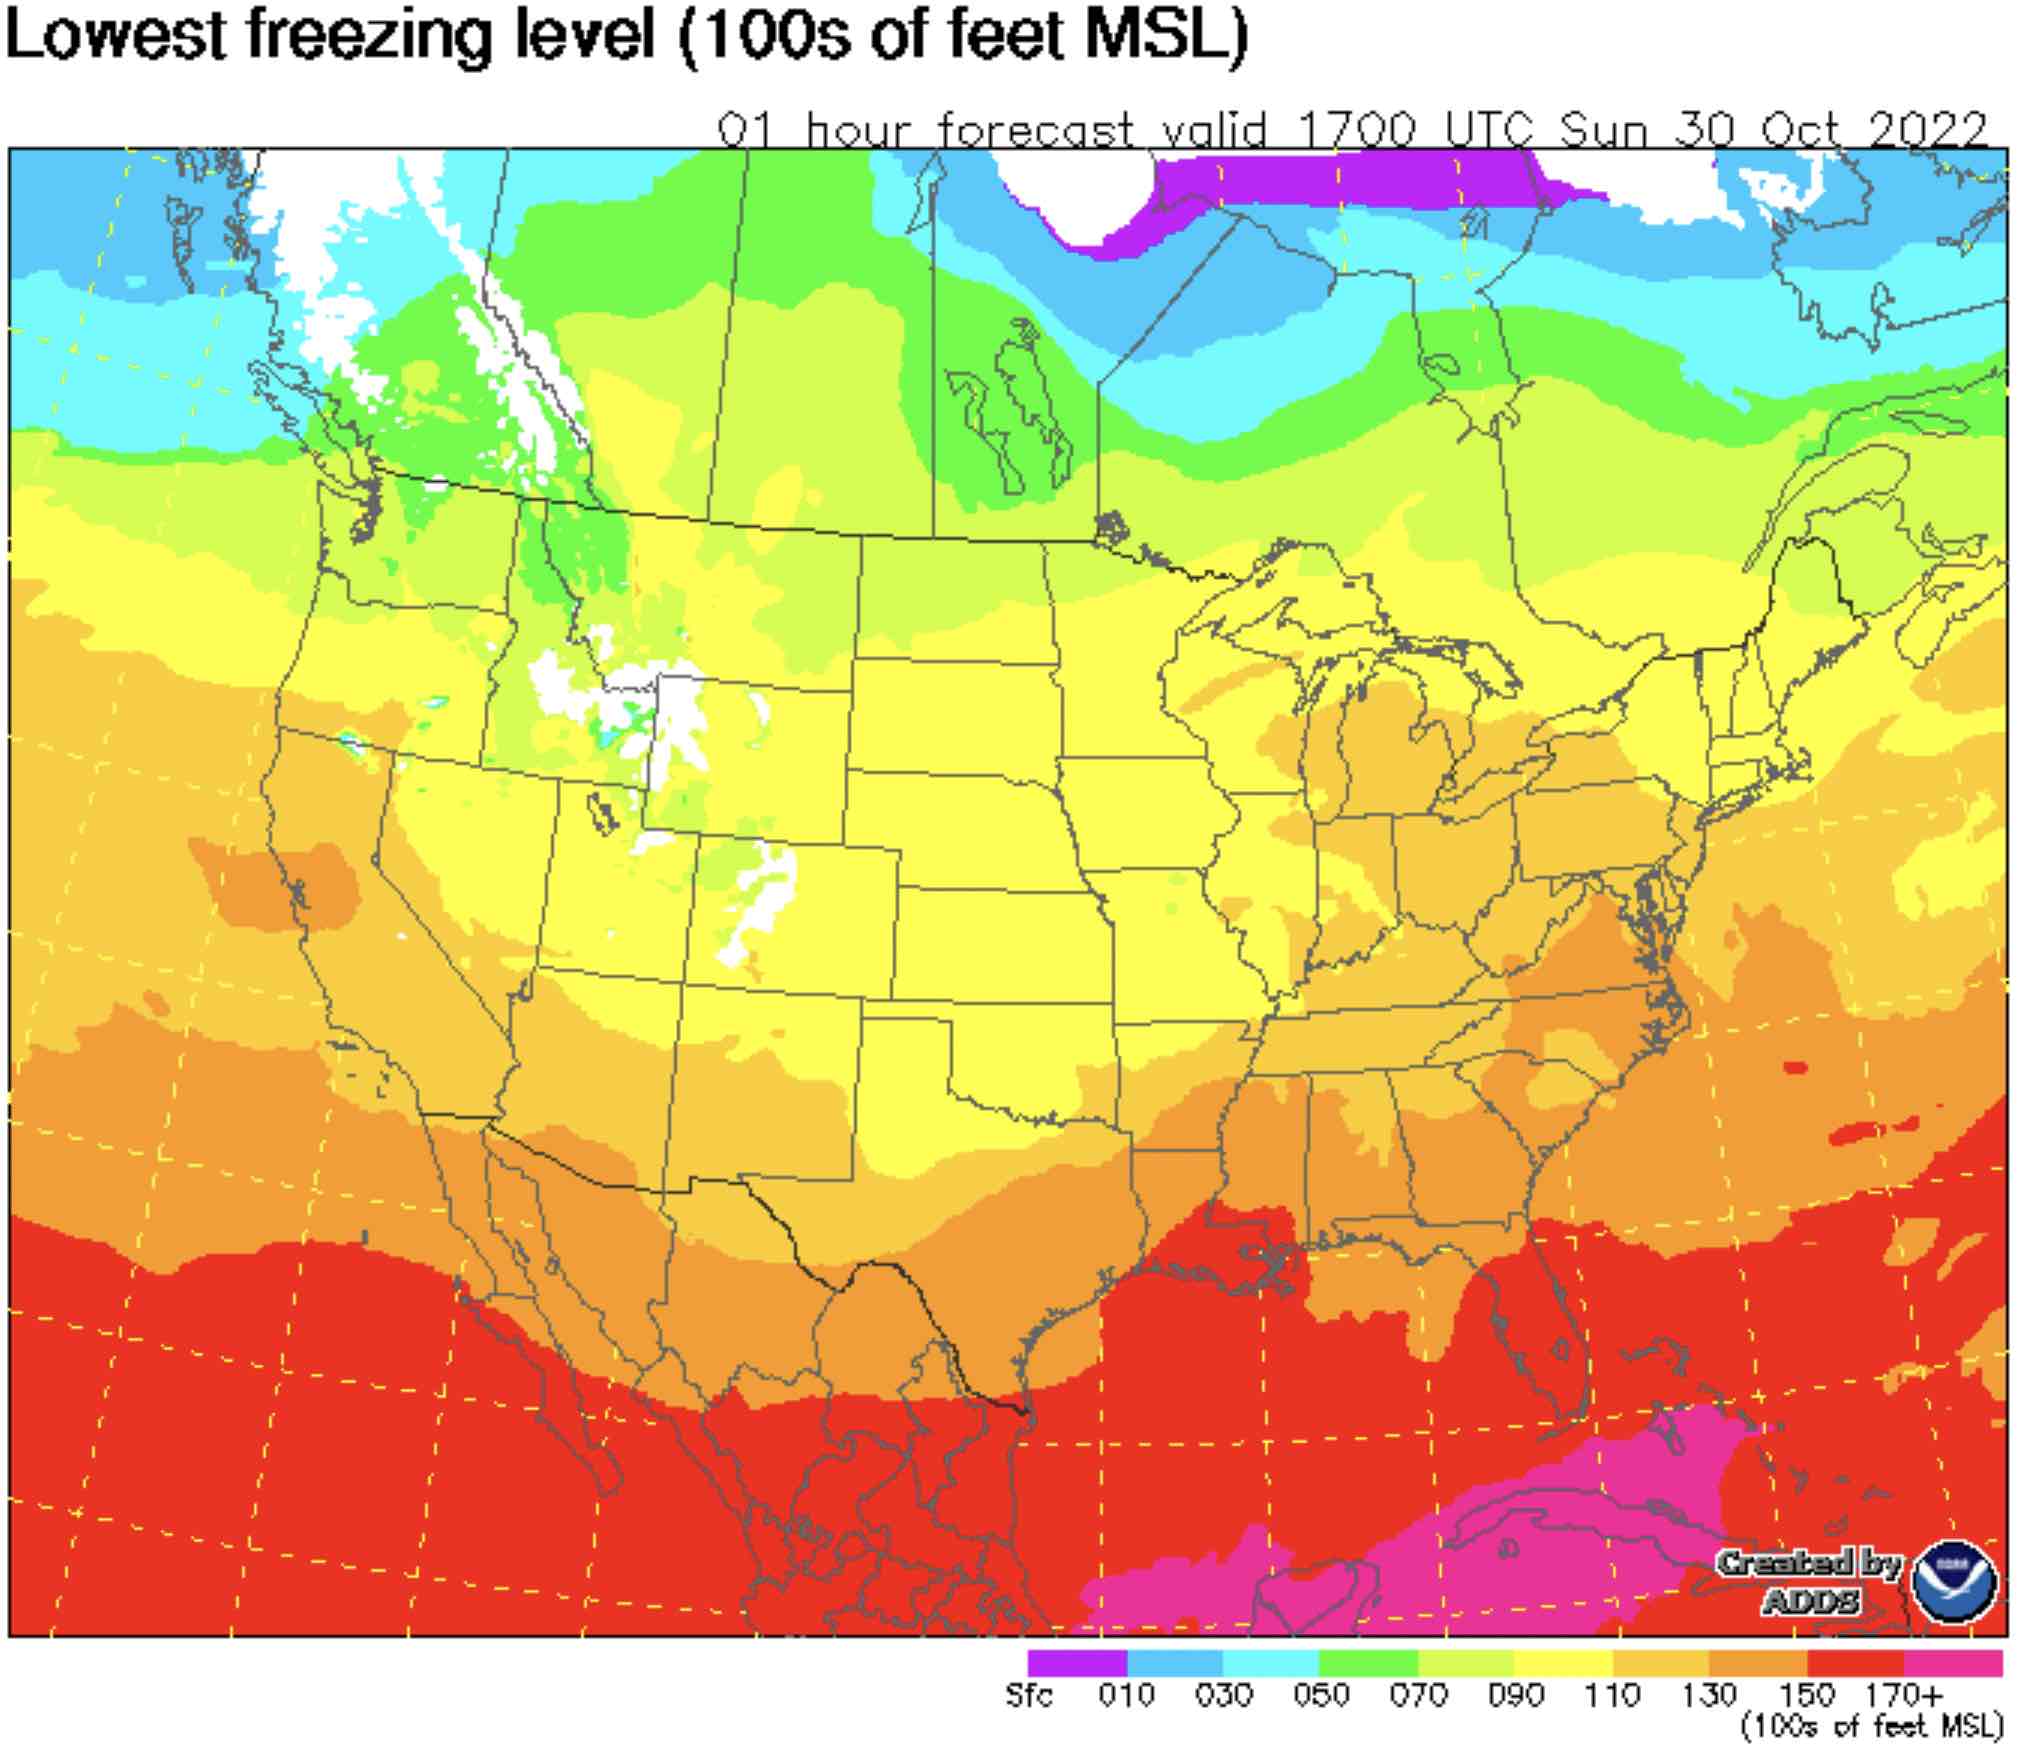
- The above seems to have been replaced by Aviation Weather Center GFA Temperature
Stability Charts
- This used to be the lifted index chart which is no longer produced
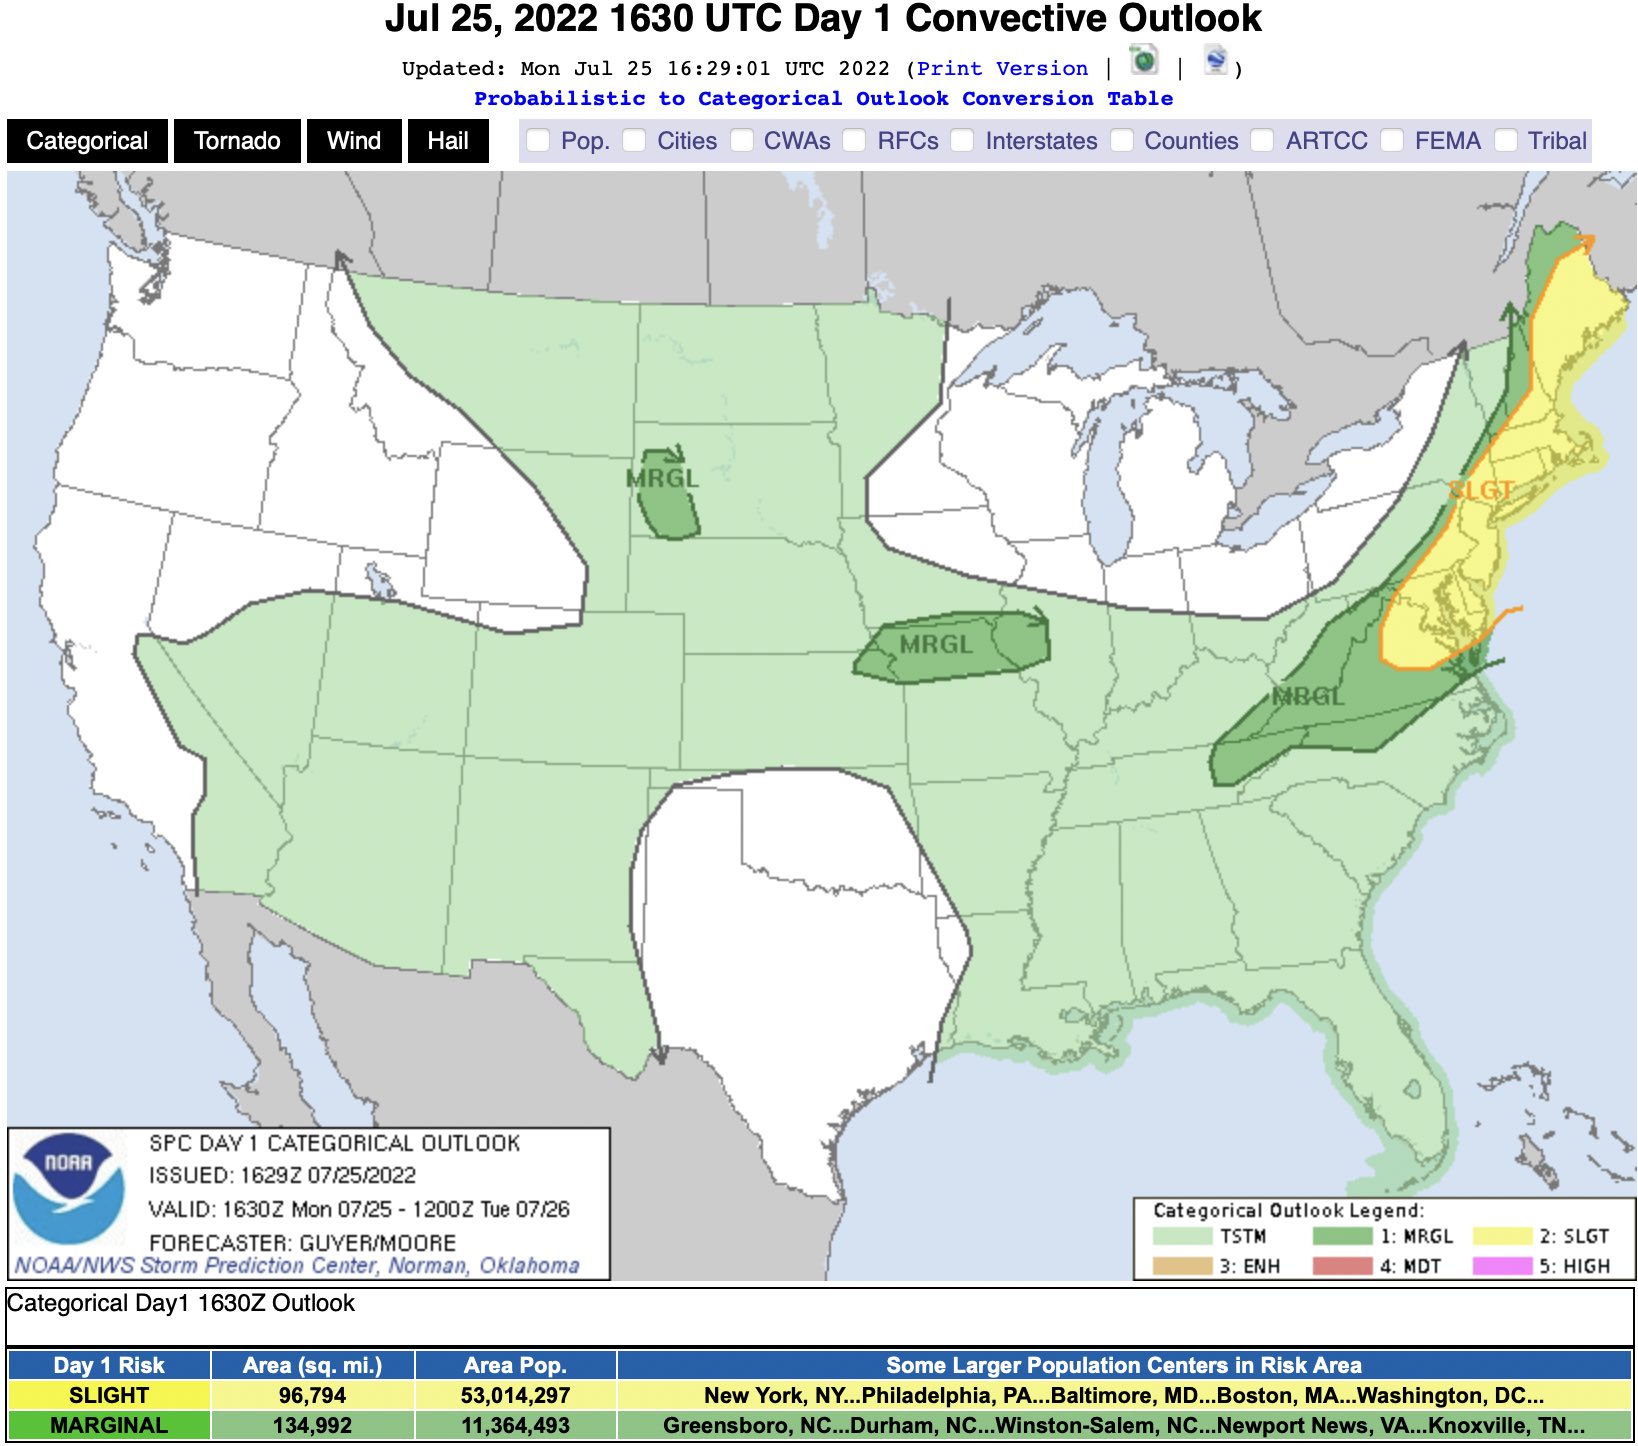
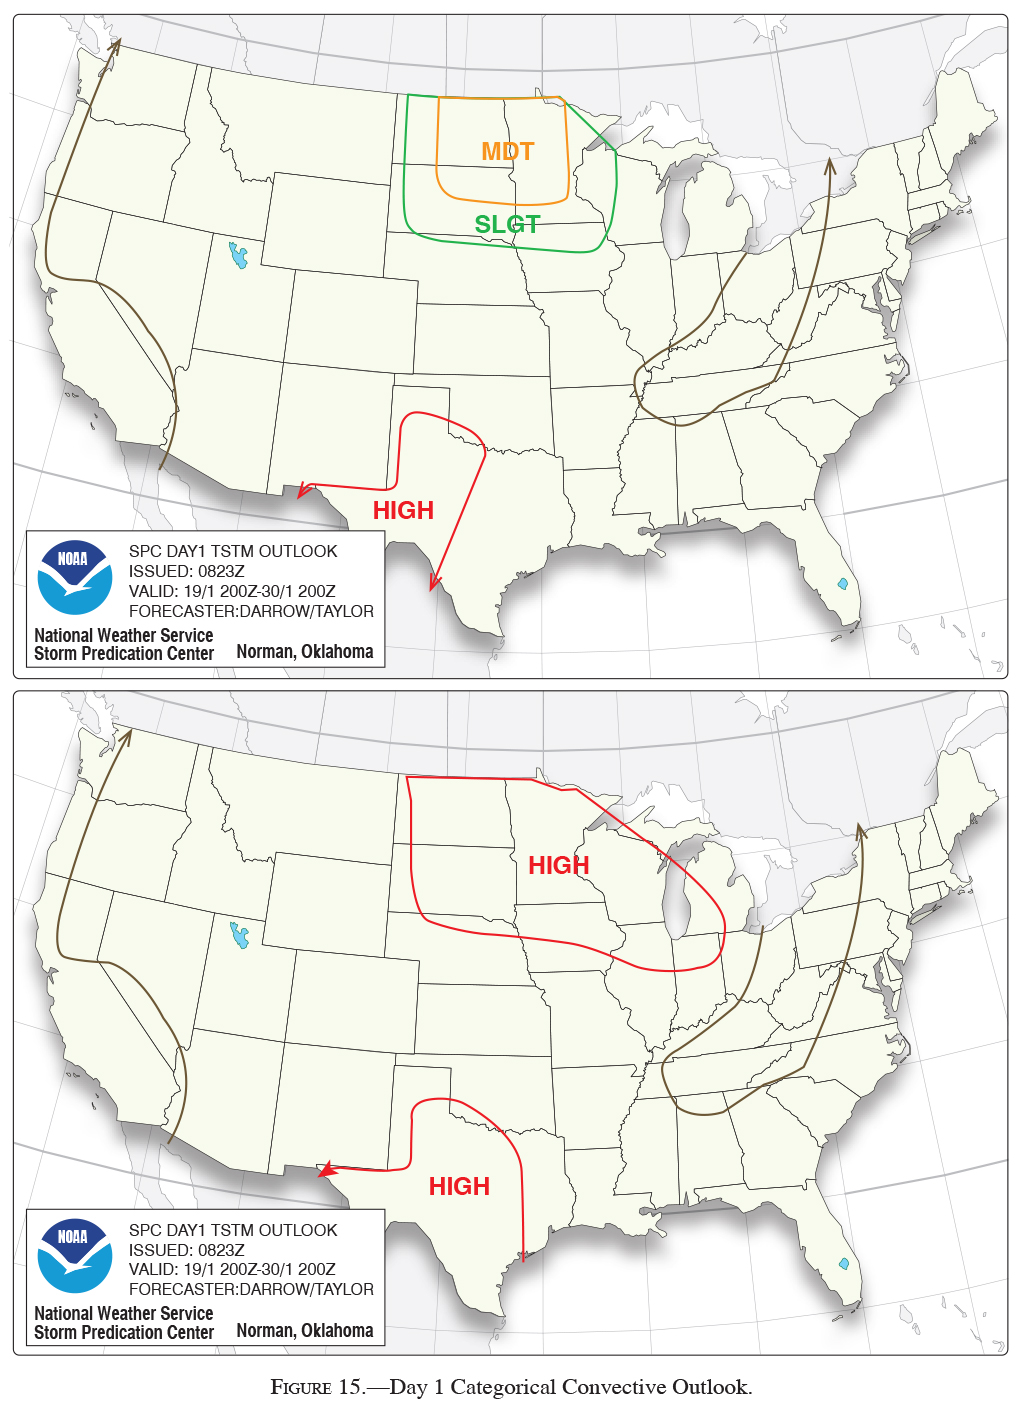
Severe Weather Outlook Charts
- See NOAA's National Weather Service Storm Prediction Center Convective Outlook Chart
TAF
- Terminal Aerodrome Forecast (TAF)
- Covers five statute mile radius around an airport
- Each TAF is valid for a 24 or 30-hour time period and is updated four times a day at 0000Z, 0600Z, 1200Z, and 1800Z
- 30 hour TAFs are usually at airports that serve long-range aircraft, so they can get their TAFs in more advance before taking off
- Some common
NSW- No significant weatherSKC- Sky clearSLP- Sea level pressureTEMPO- Last for less than an hour and occur during less than half of the time period specified
Example 1
KIAD 241741Z 2418/2524 10006KT 2SM -RA OVC006 WS020/17040KT
    FM242000 14015G23KT 3SM -SHRA VCTS OVC015CB
    TEMPO 2420/2424 VRB40KT 1SM +TSRA BKN008 OVC015CB
    FM250000 18012G16KT 6SM -SHRA BKN040
    FM250200 20014G21KT P6SM BKN060
FM251300 26018G27KT P6SM BKN050- TAF
241741Z- Issuance time
2418/2524- Valid period
WS020/17040KT- Wind shear 2000 AGL
- Wind 170 at 40 knots at the top of the wind shear layer
VCTS- Thunderstorms in the vicinity
Area Forecast
Area Forecast (FA)
aviationweather.gov has discontinued textual area forecasts, but it seems they are still on FAA exams
From https://www.aviationweather.gov/areafcst:
THE TEXT AREA FORECAST FOR THE CONTIGUOUS UNITED STATES HAS BEEN DISCONTINUED. TO GET THE FORECAST FOR THESE AREAS CHECK THE GFA TOOL.
The FA gives a picture of clouds, general weather conditions, and visual meteorological conditions (VMC) expected over a large area encompassing several states.
There are six areas for which area forecasts are published in the contiguous 48 states.
Area forecasts are issued three times a day and are valid for 18 hours.
Note the difference in valid time of 12 hours for the forecast and an additional 6 for the categorical outlook
- I'm not really sure exactly the difference between these two
- On the FAA exam, they will try to trick based on these two things
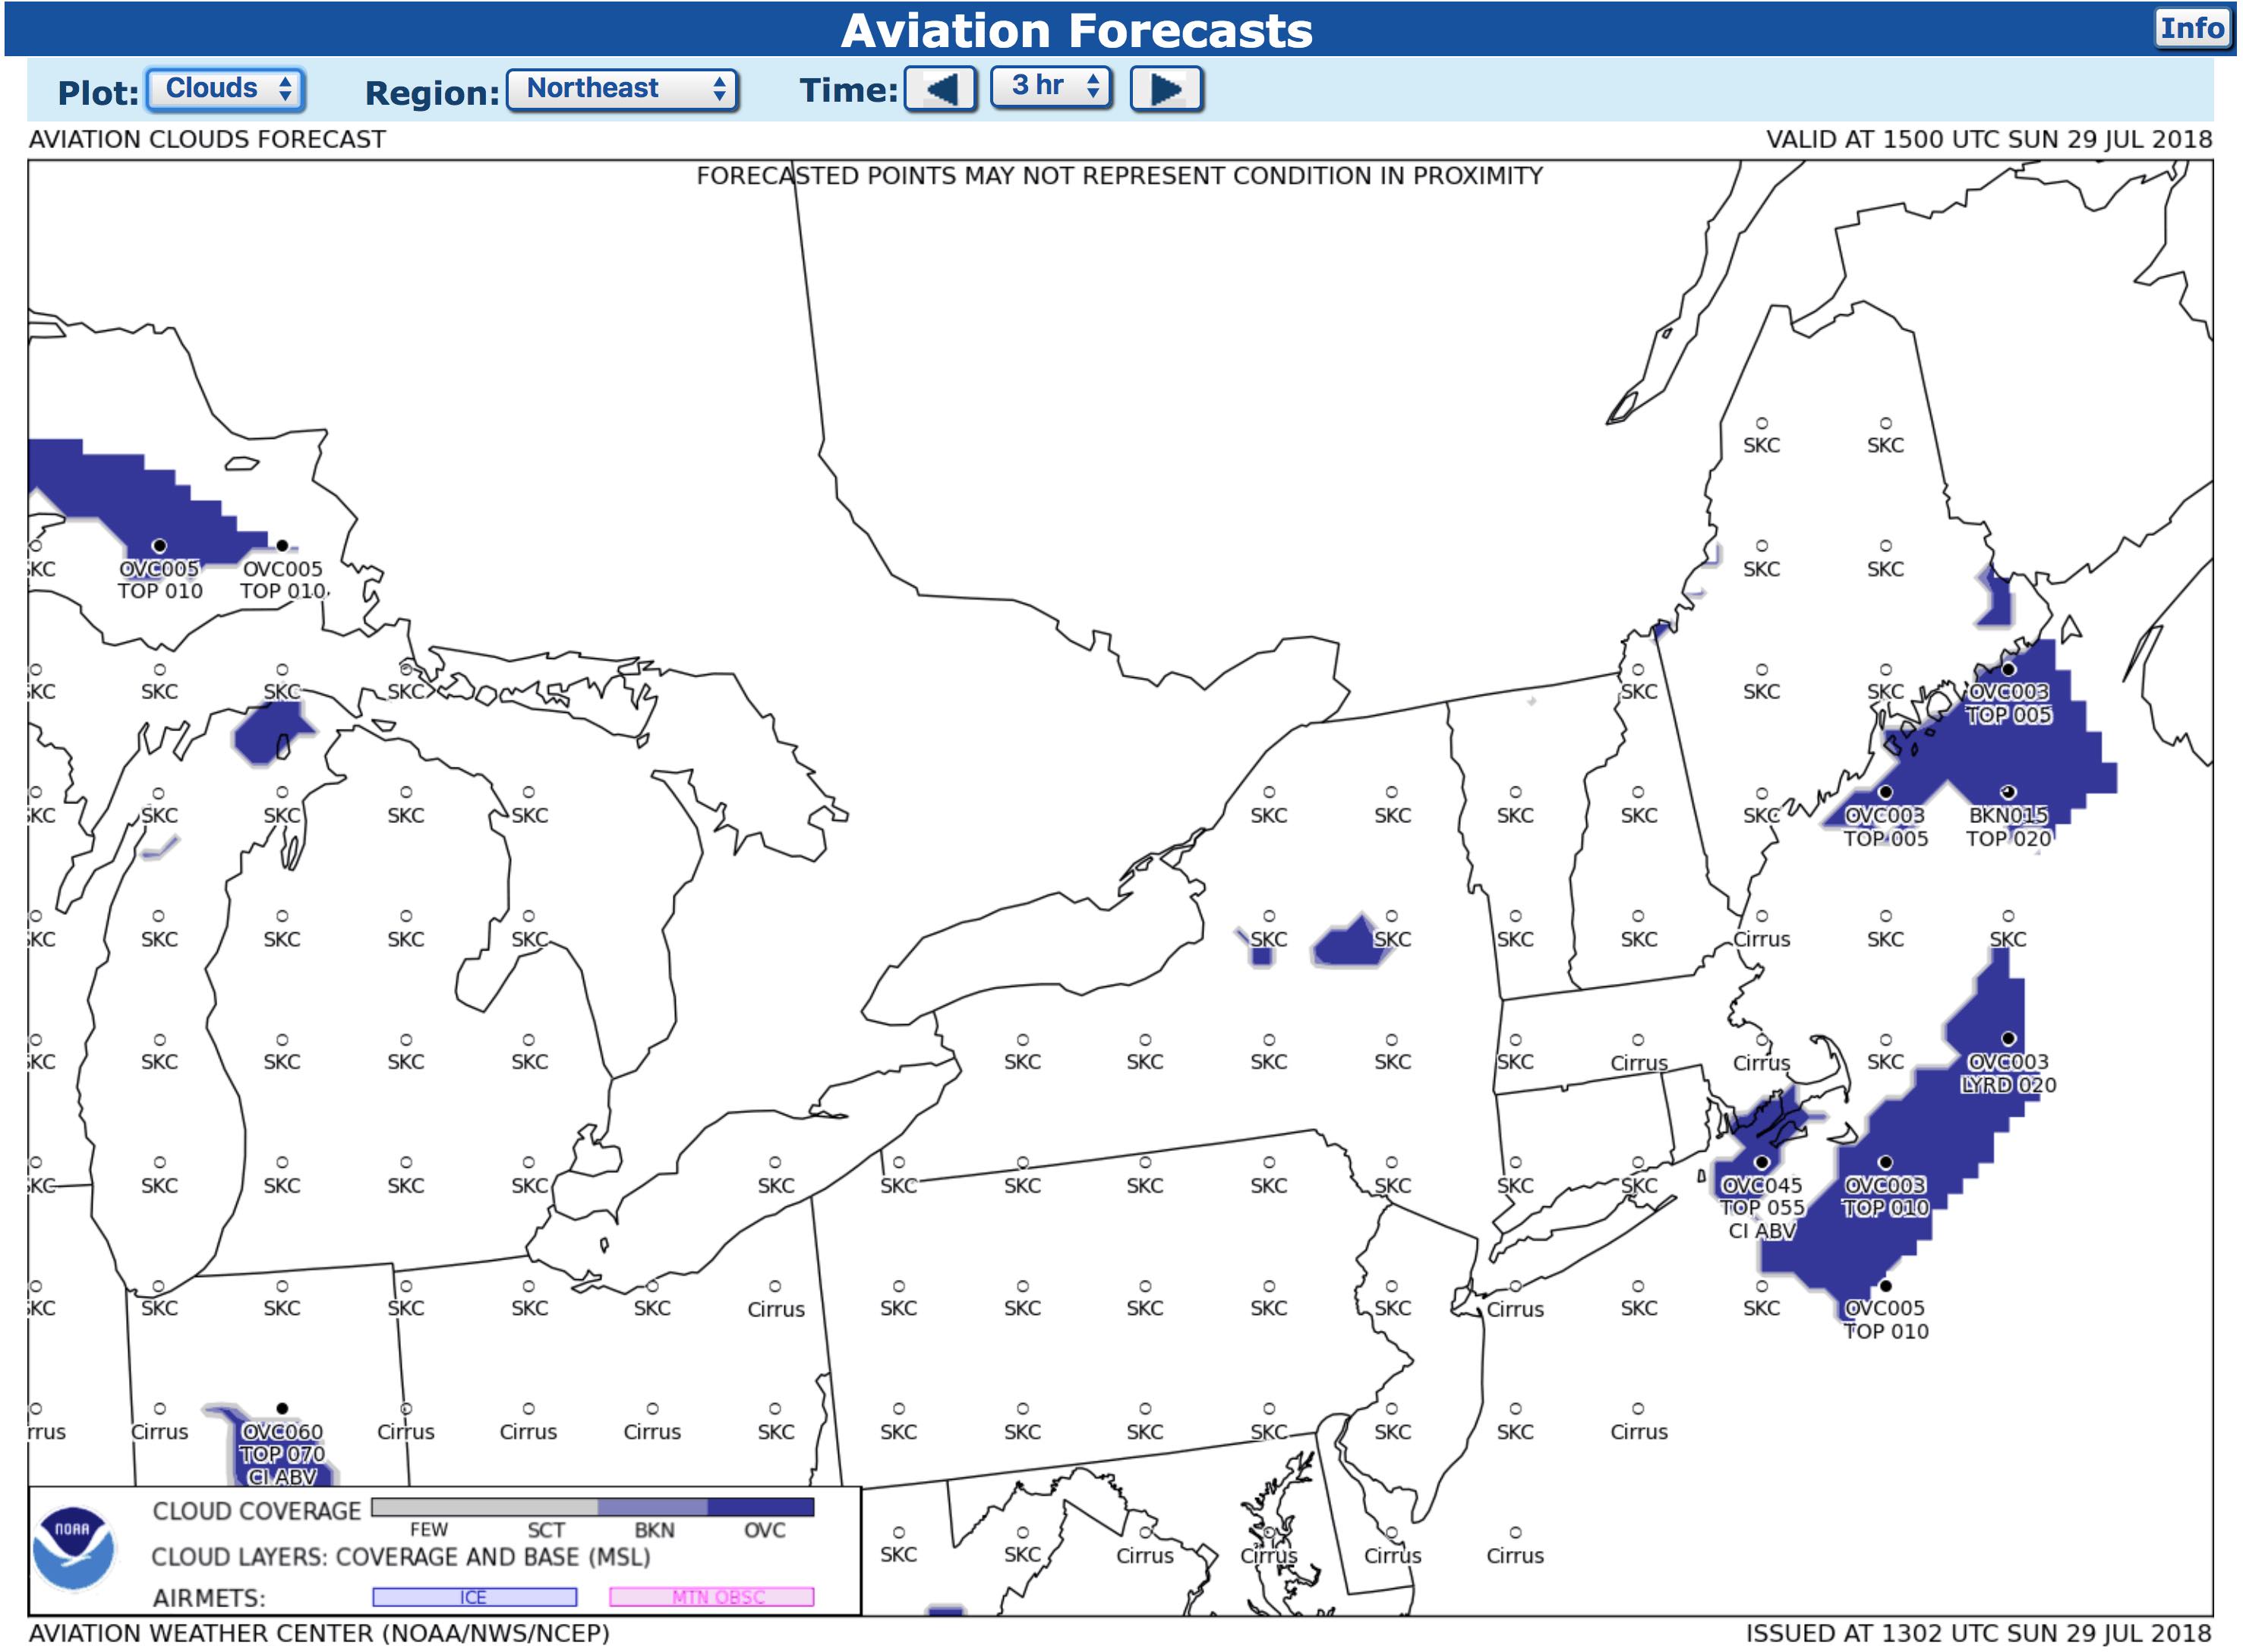
Graphical Forecast for Aviation
Old GFA
- Graphical Forecast for Aviation (GFA)
- To replace the textual area forecast (FA)
- Gives a brief summary of the location and movement of fronts, pressure systems, and circulation patterns
- The forecast is valid for 12 hours with an additional 6 hours categorical outlook
- The links below may have been changed or broken, and are left here as evidence of tools are easily deprecated and changed in favor of new ones
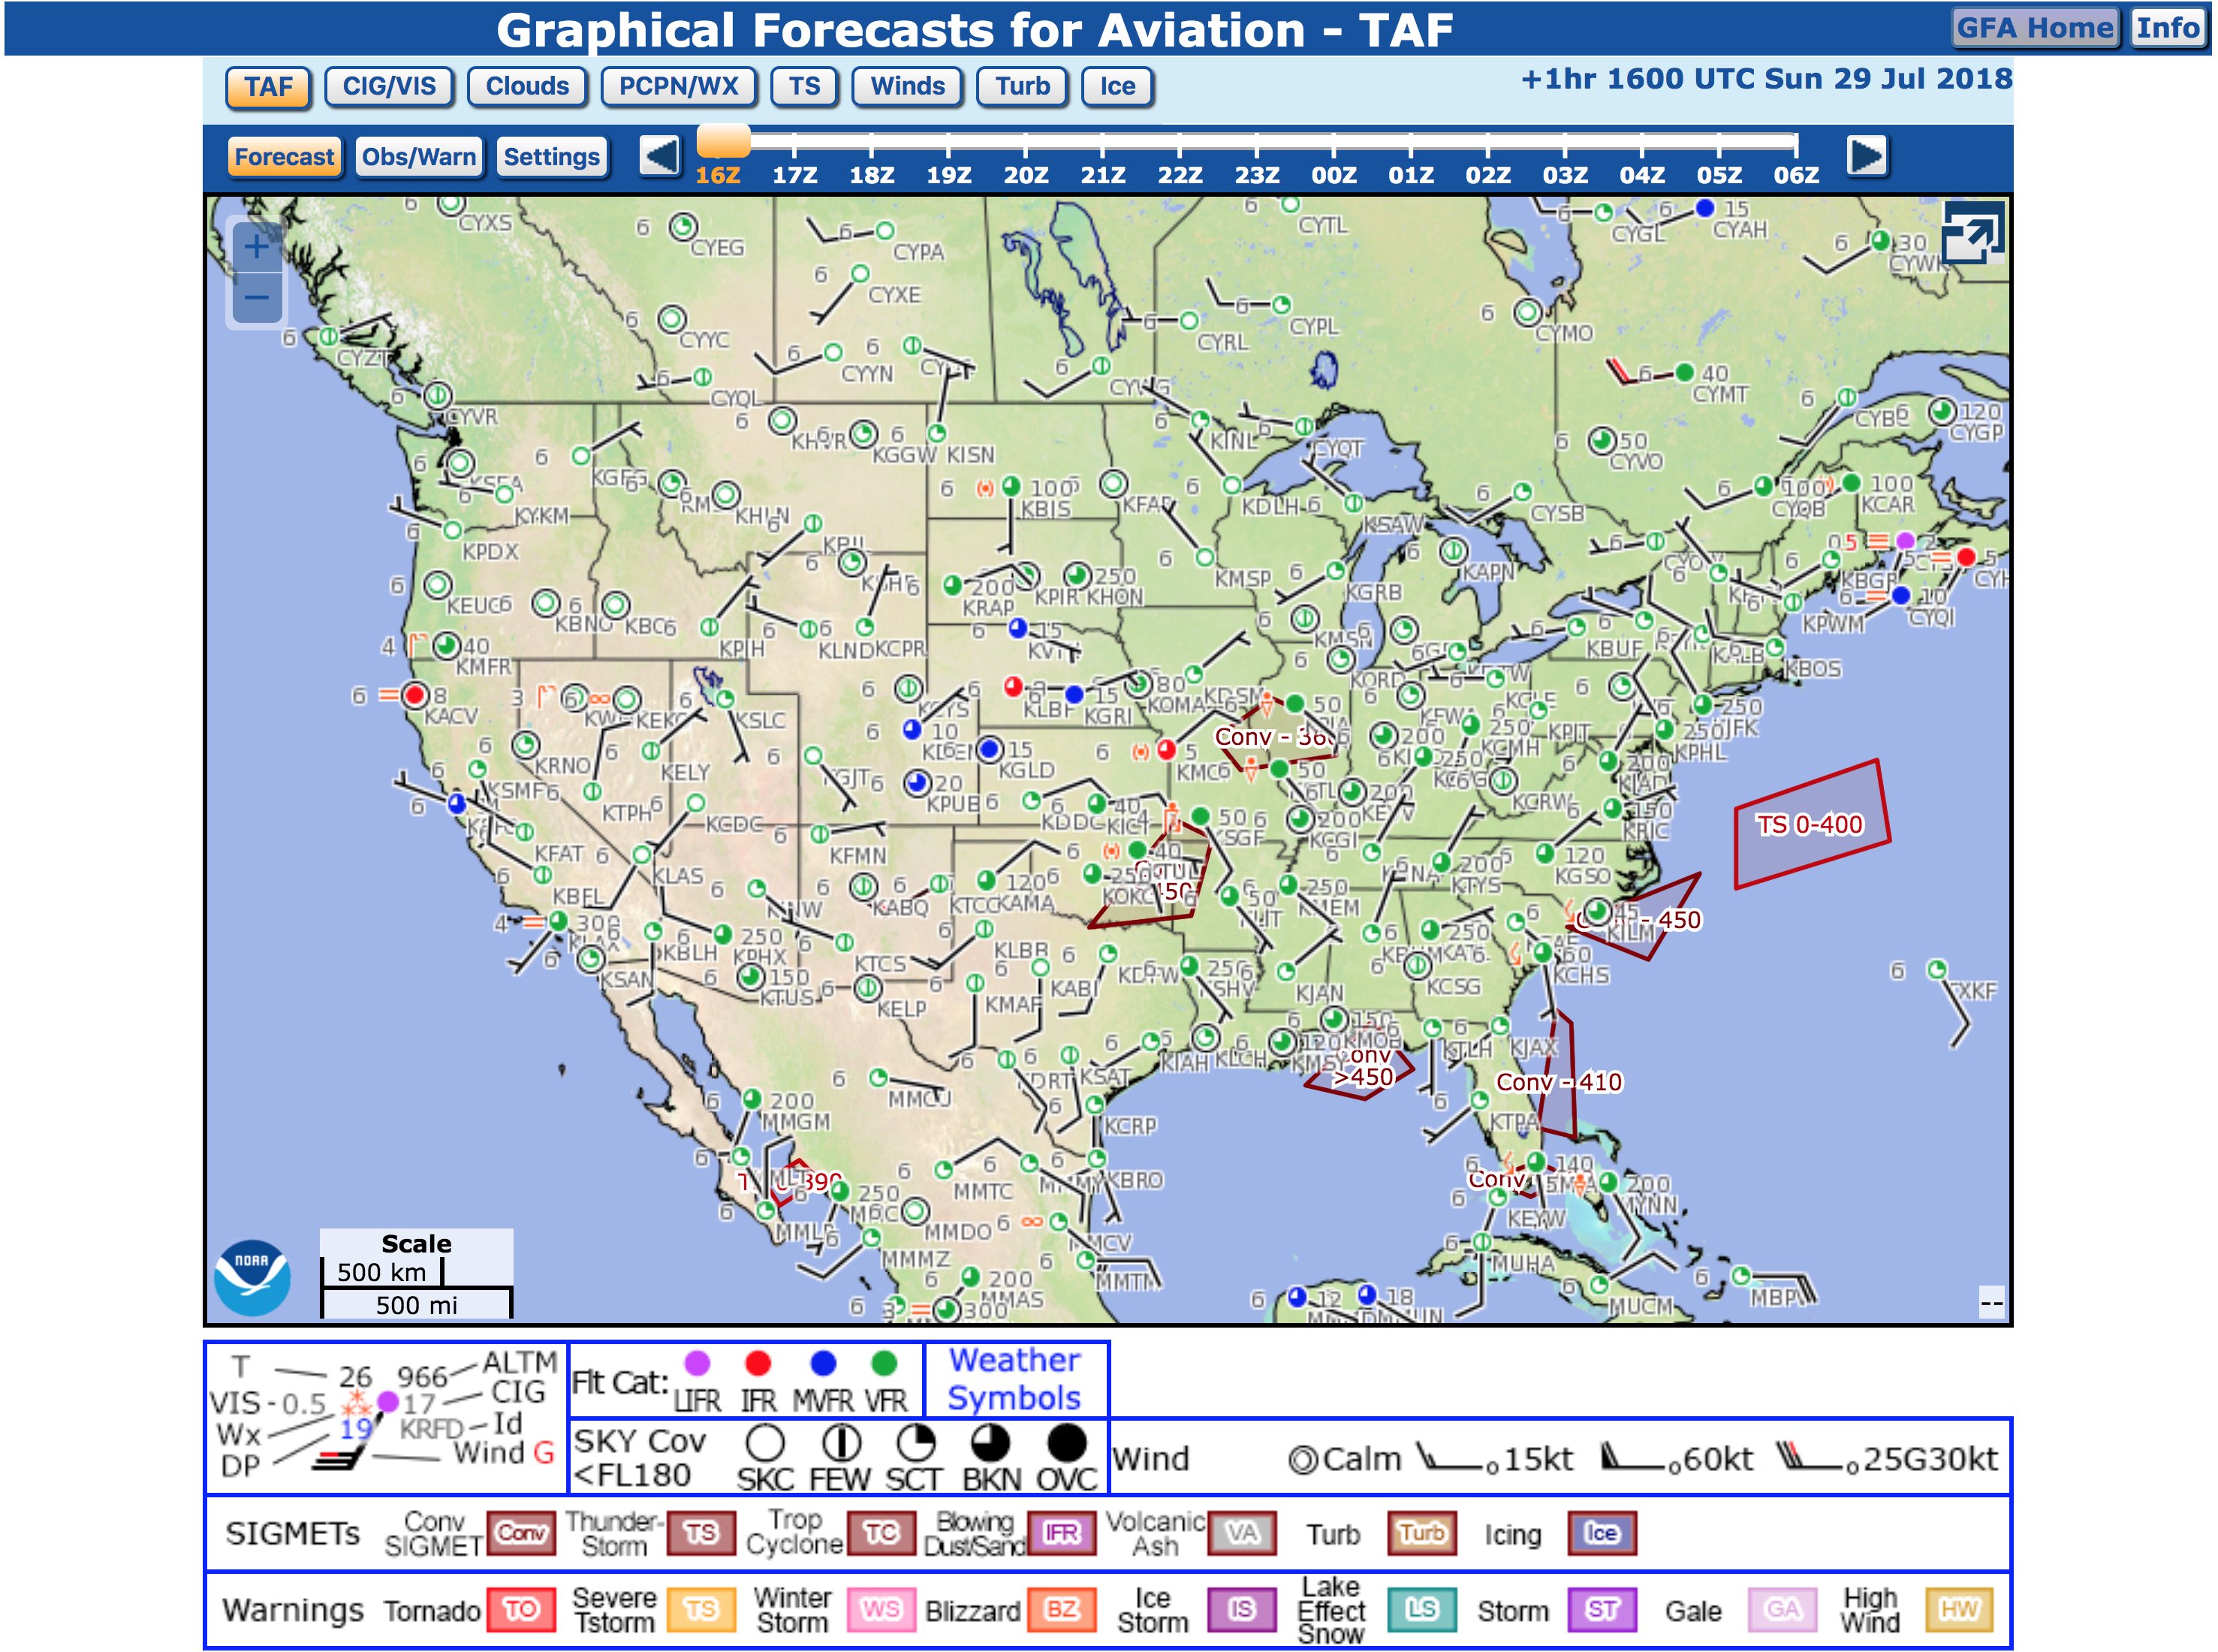
- Can select
- Region
- Forecast time
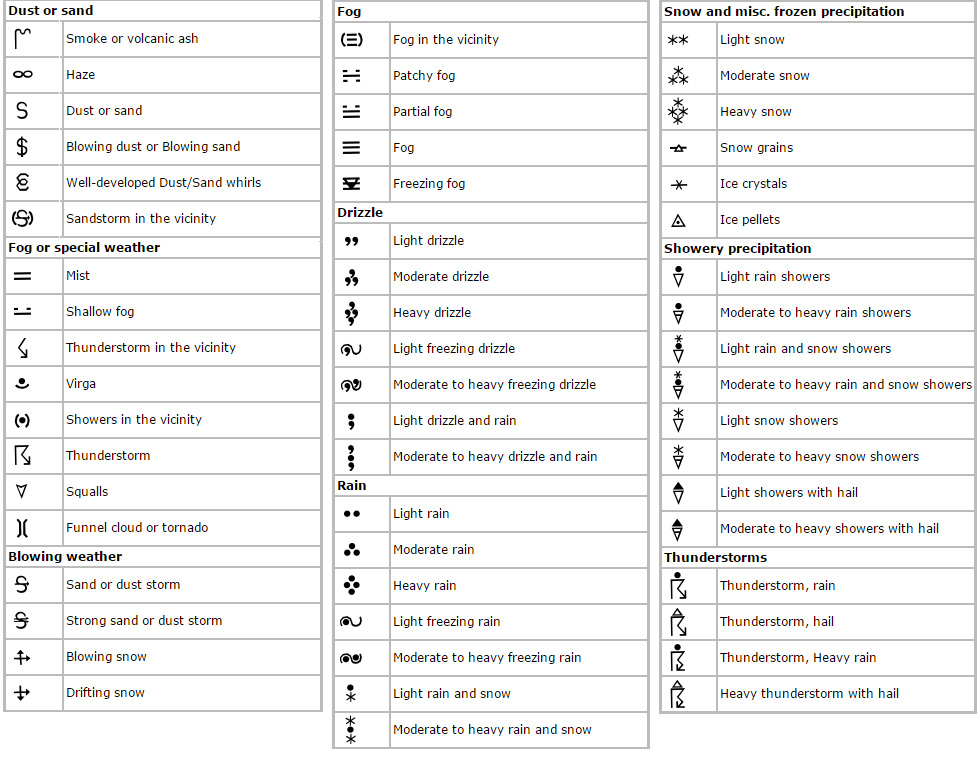
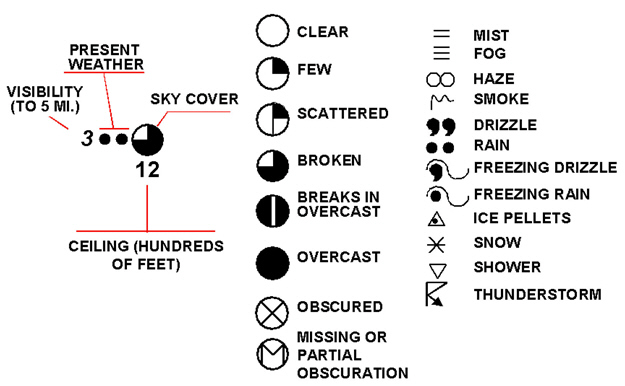
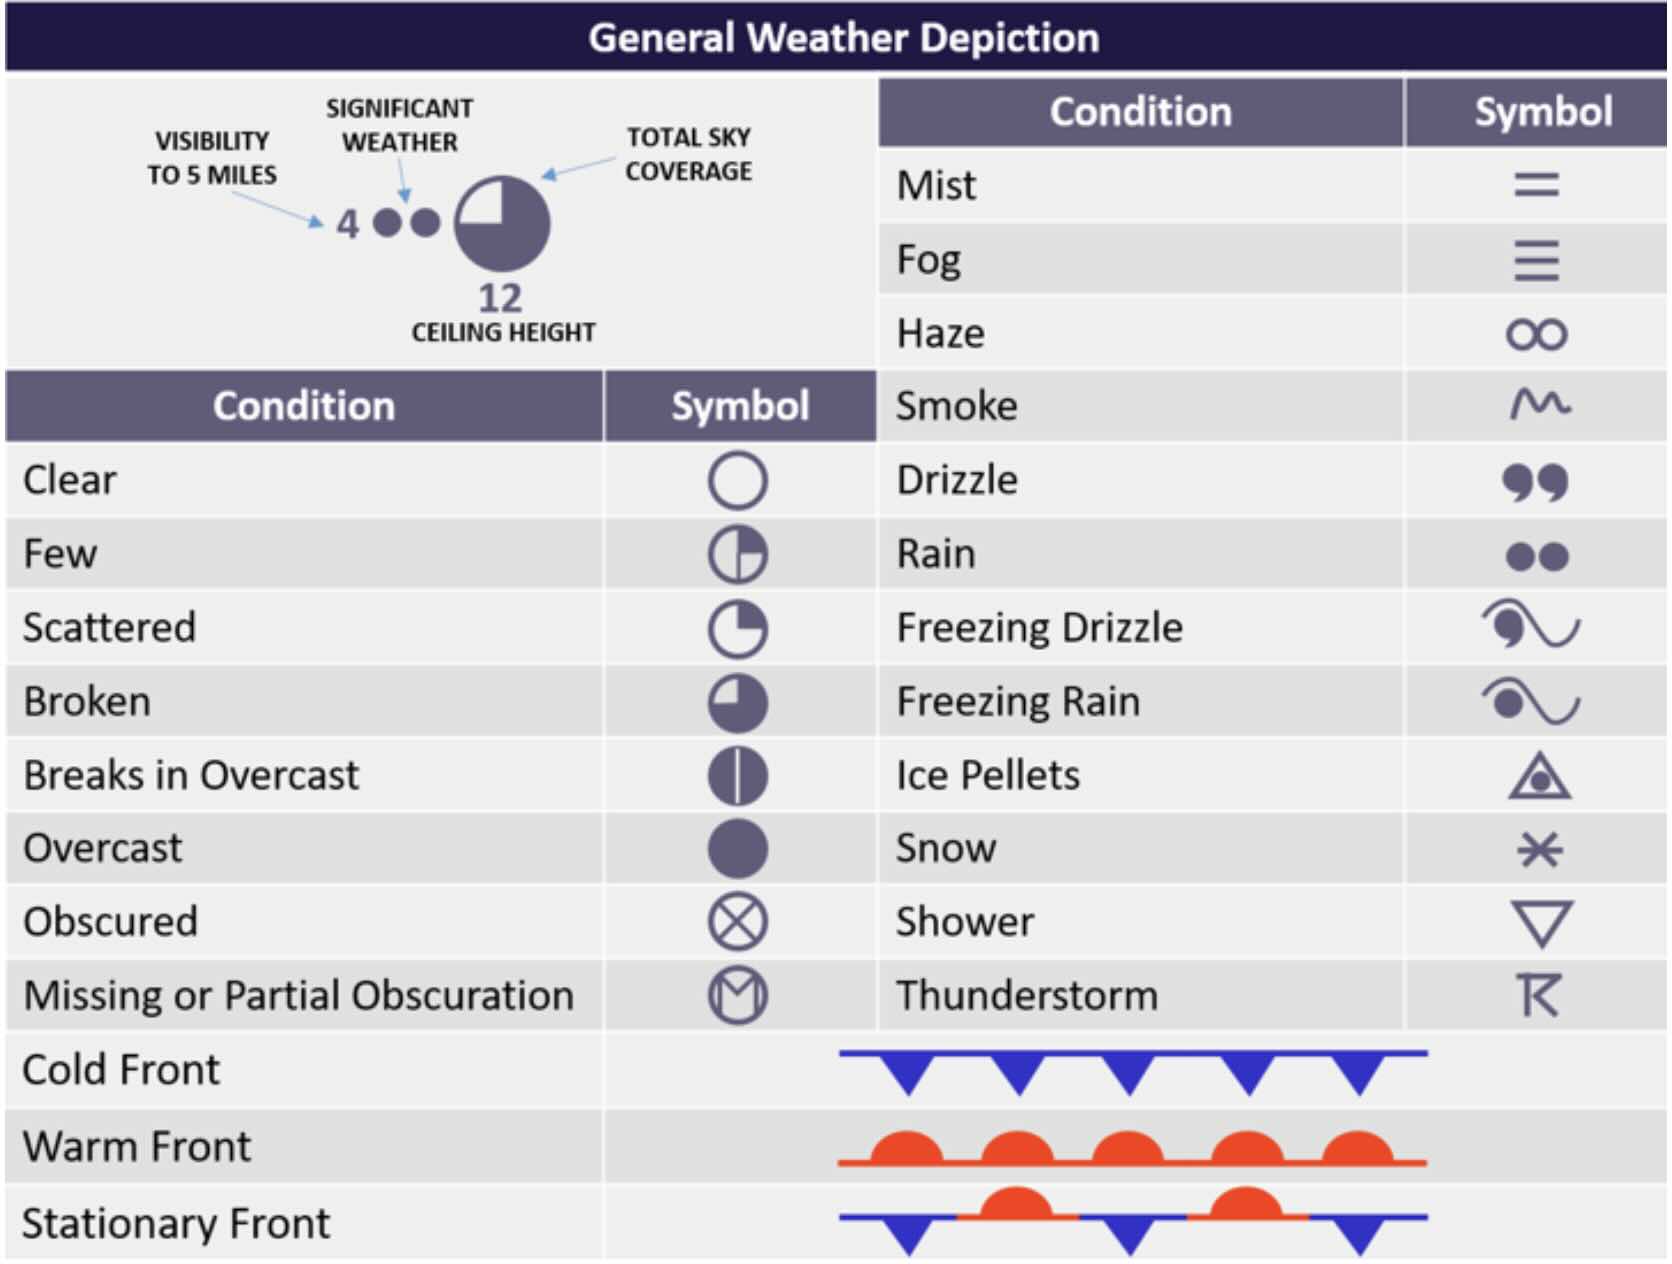
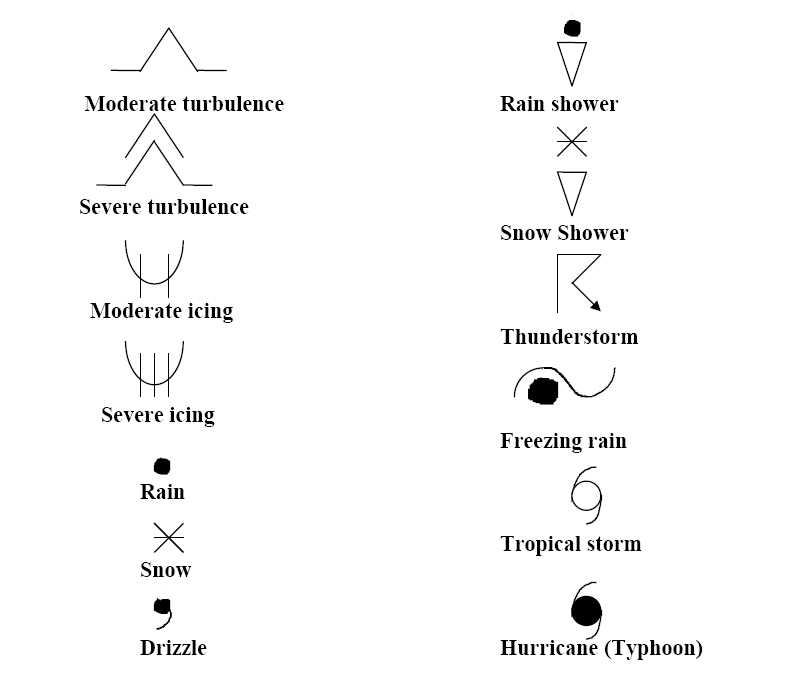
- Dots represent types of significant weather
- e.g. 2 dots = light rain
- See: Weather Symbols or figure below
- Red wind barb means gusting
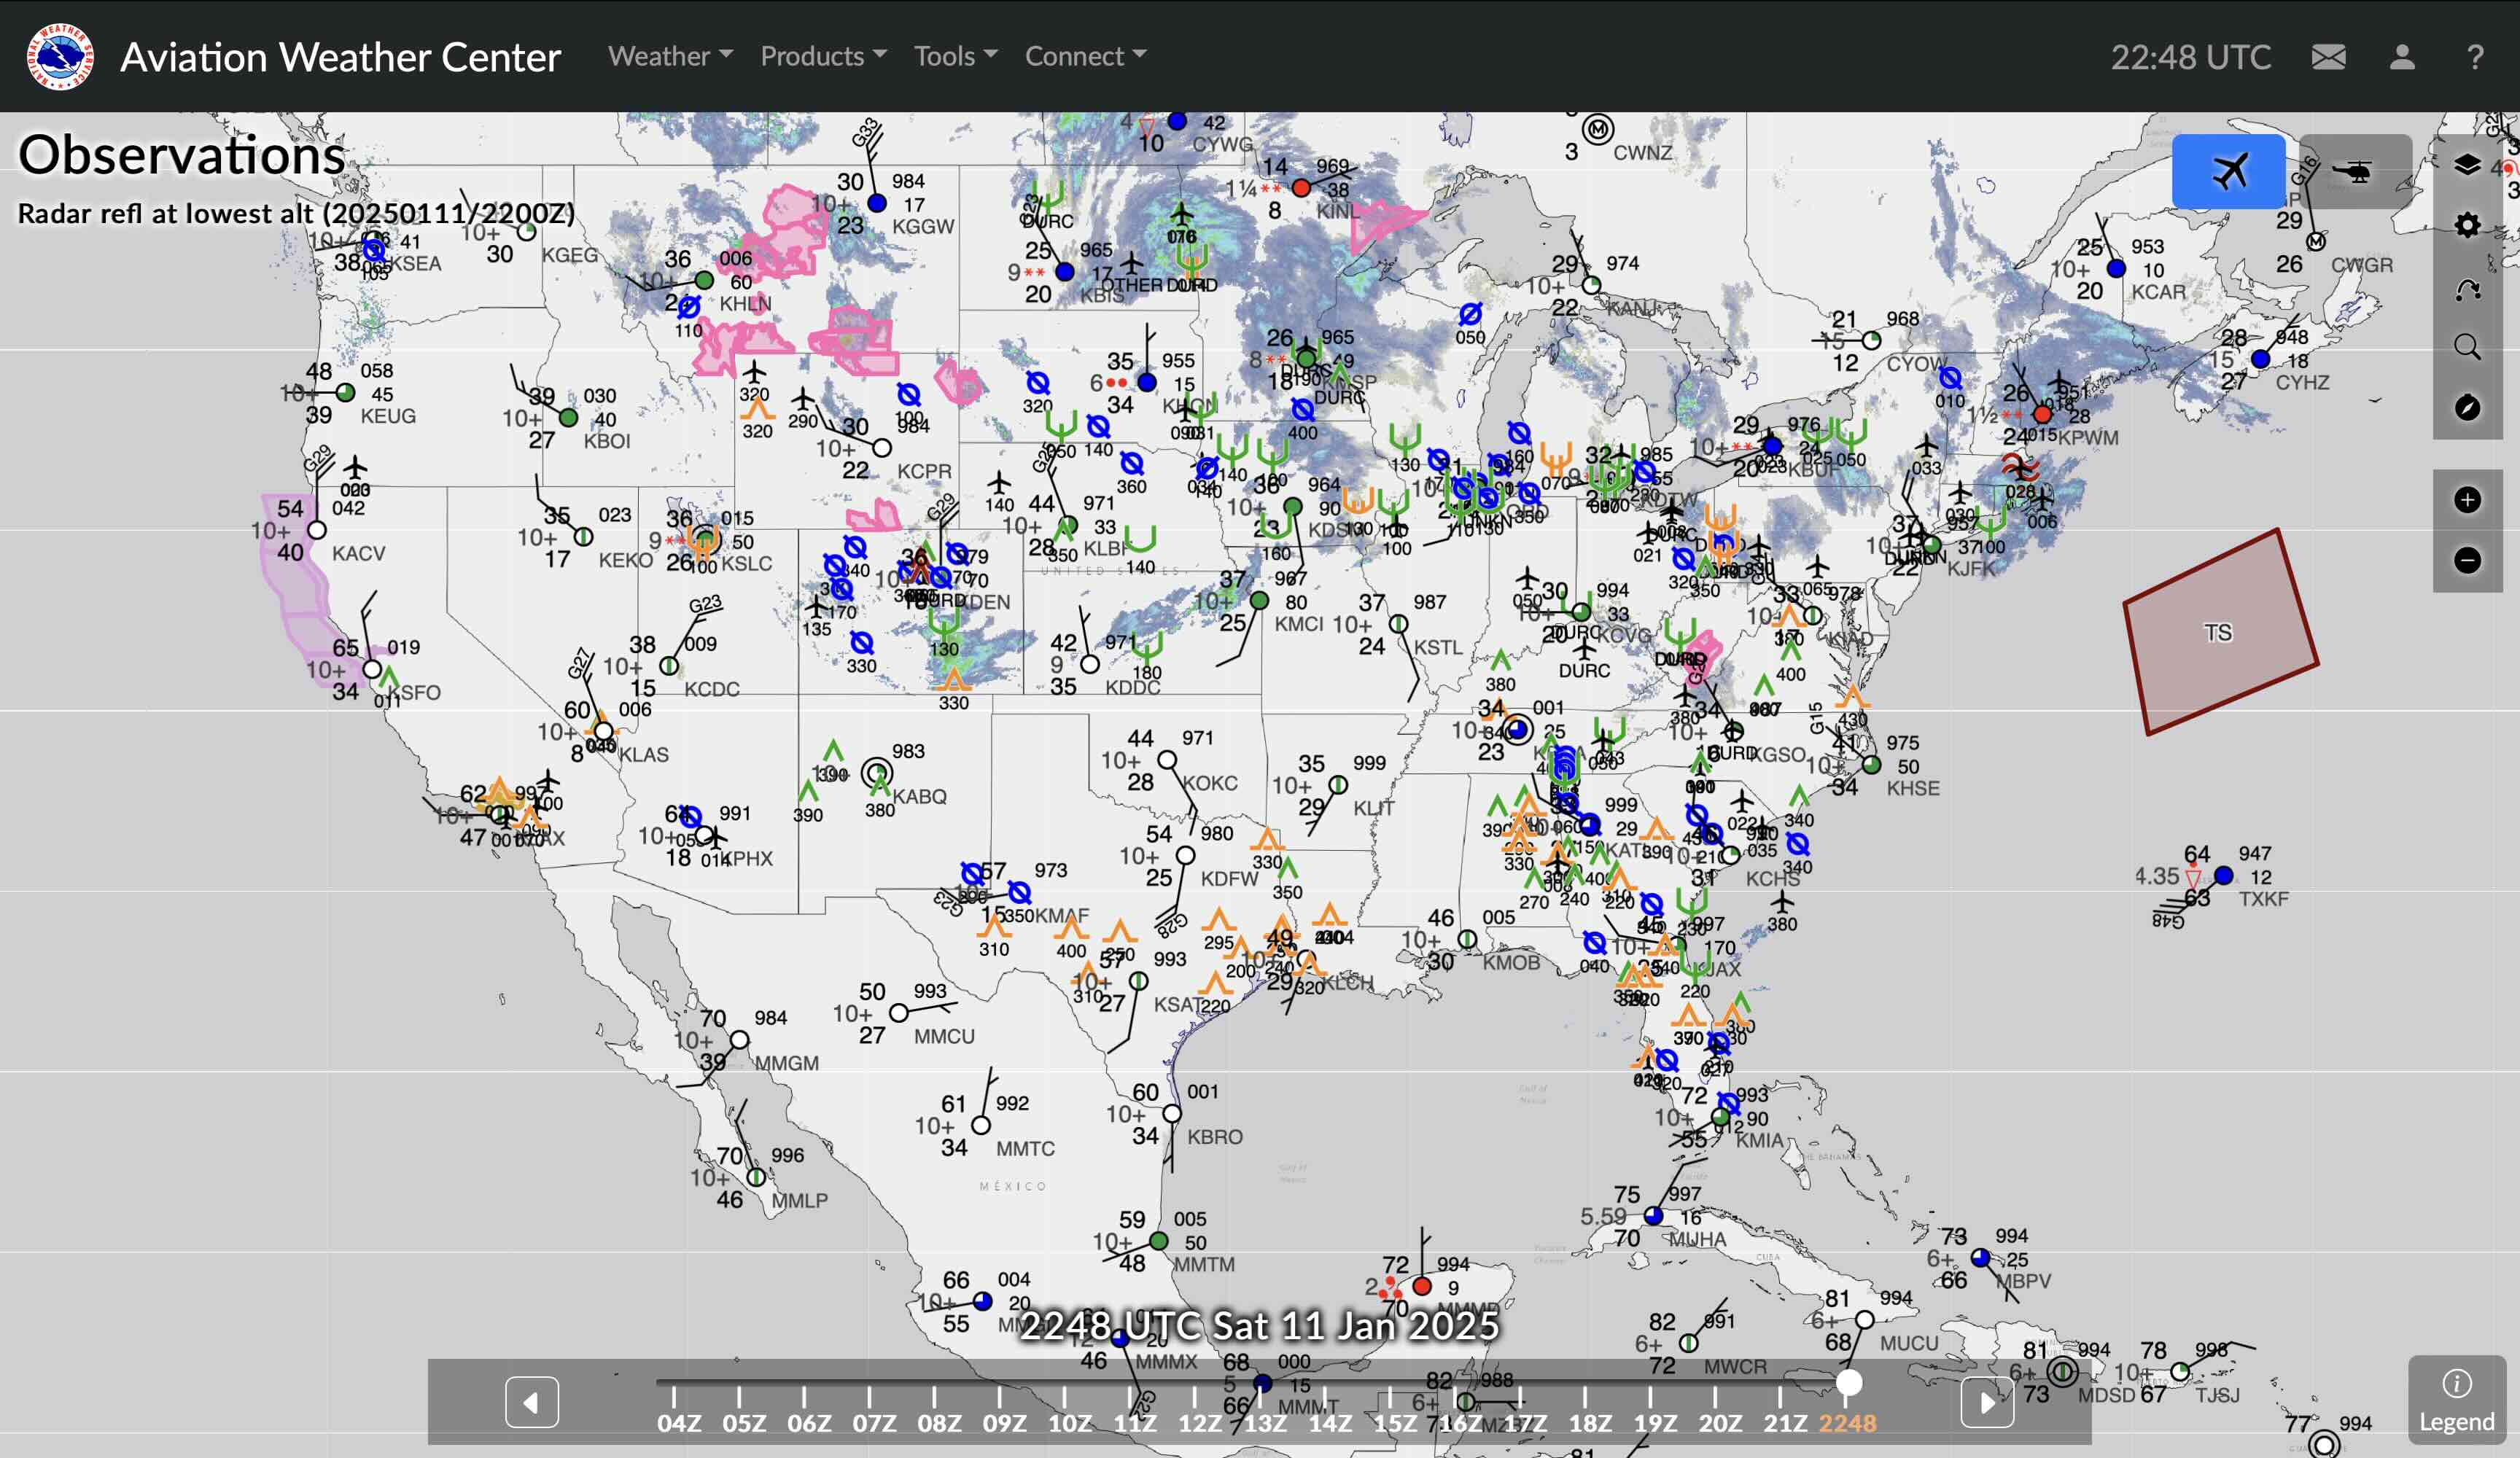
New GFA
- Newer iterations of this tool seems to have replaced many other existing charts and combined them into this page
- See aviationweather.gov/gfa
- See the help page to learn more about the tool
Winds and Temperatures Aloft
Textual
- Winds and Temperatures Aloft Forecast - Textual (FD)
- See also the graphical version Winds and Temperatures Aloft Forecast - Graphical (FB)
- See Aviation Weather Center's Winds/Temps Data
- Winds and temps aloft are forecasts based on observations made a few hours prior
- Made twice a day based on the radiosonde upper air observations taken at 0000Z and 1200Z
- Format
DDSSTTwhereDis wind directionSis wind speedTis temperature
- Example
2321-04is wind from 230 at 21 knots and temperature -21 °C - No winds given below 1,000 ft AGL
- No temp is given for 3,000 ft MSL or when 2,500 ft AGL
- Above 24,000 feet all temperatures are negative so minus sign is dropped
- Wind
9900means light and variable (less than 5 kts) - For winds greater than 99 knots, add
50to theDDand subtract 100 from the wind speed to getSSvalues- Example:
7545means winds of 145 knots from 250
- Example:
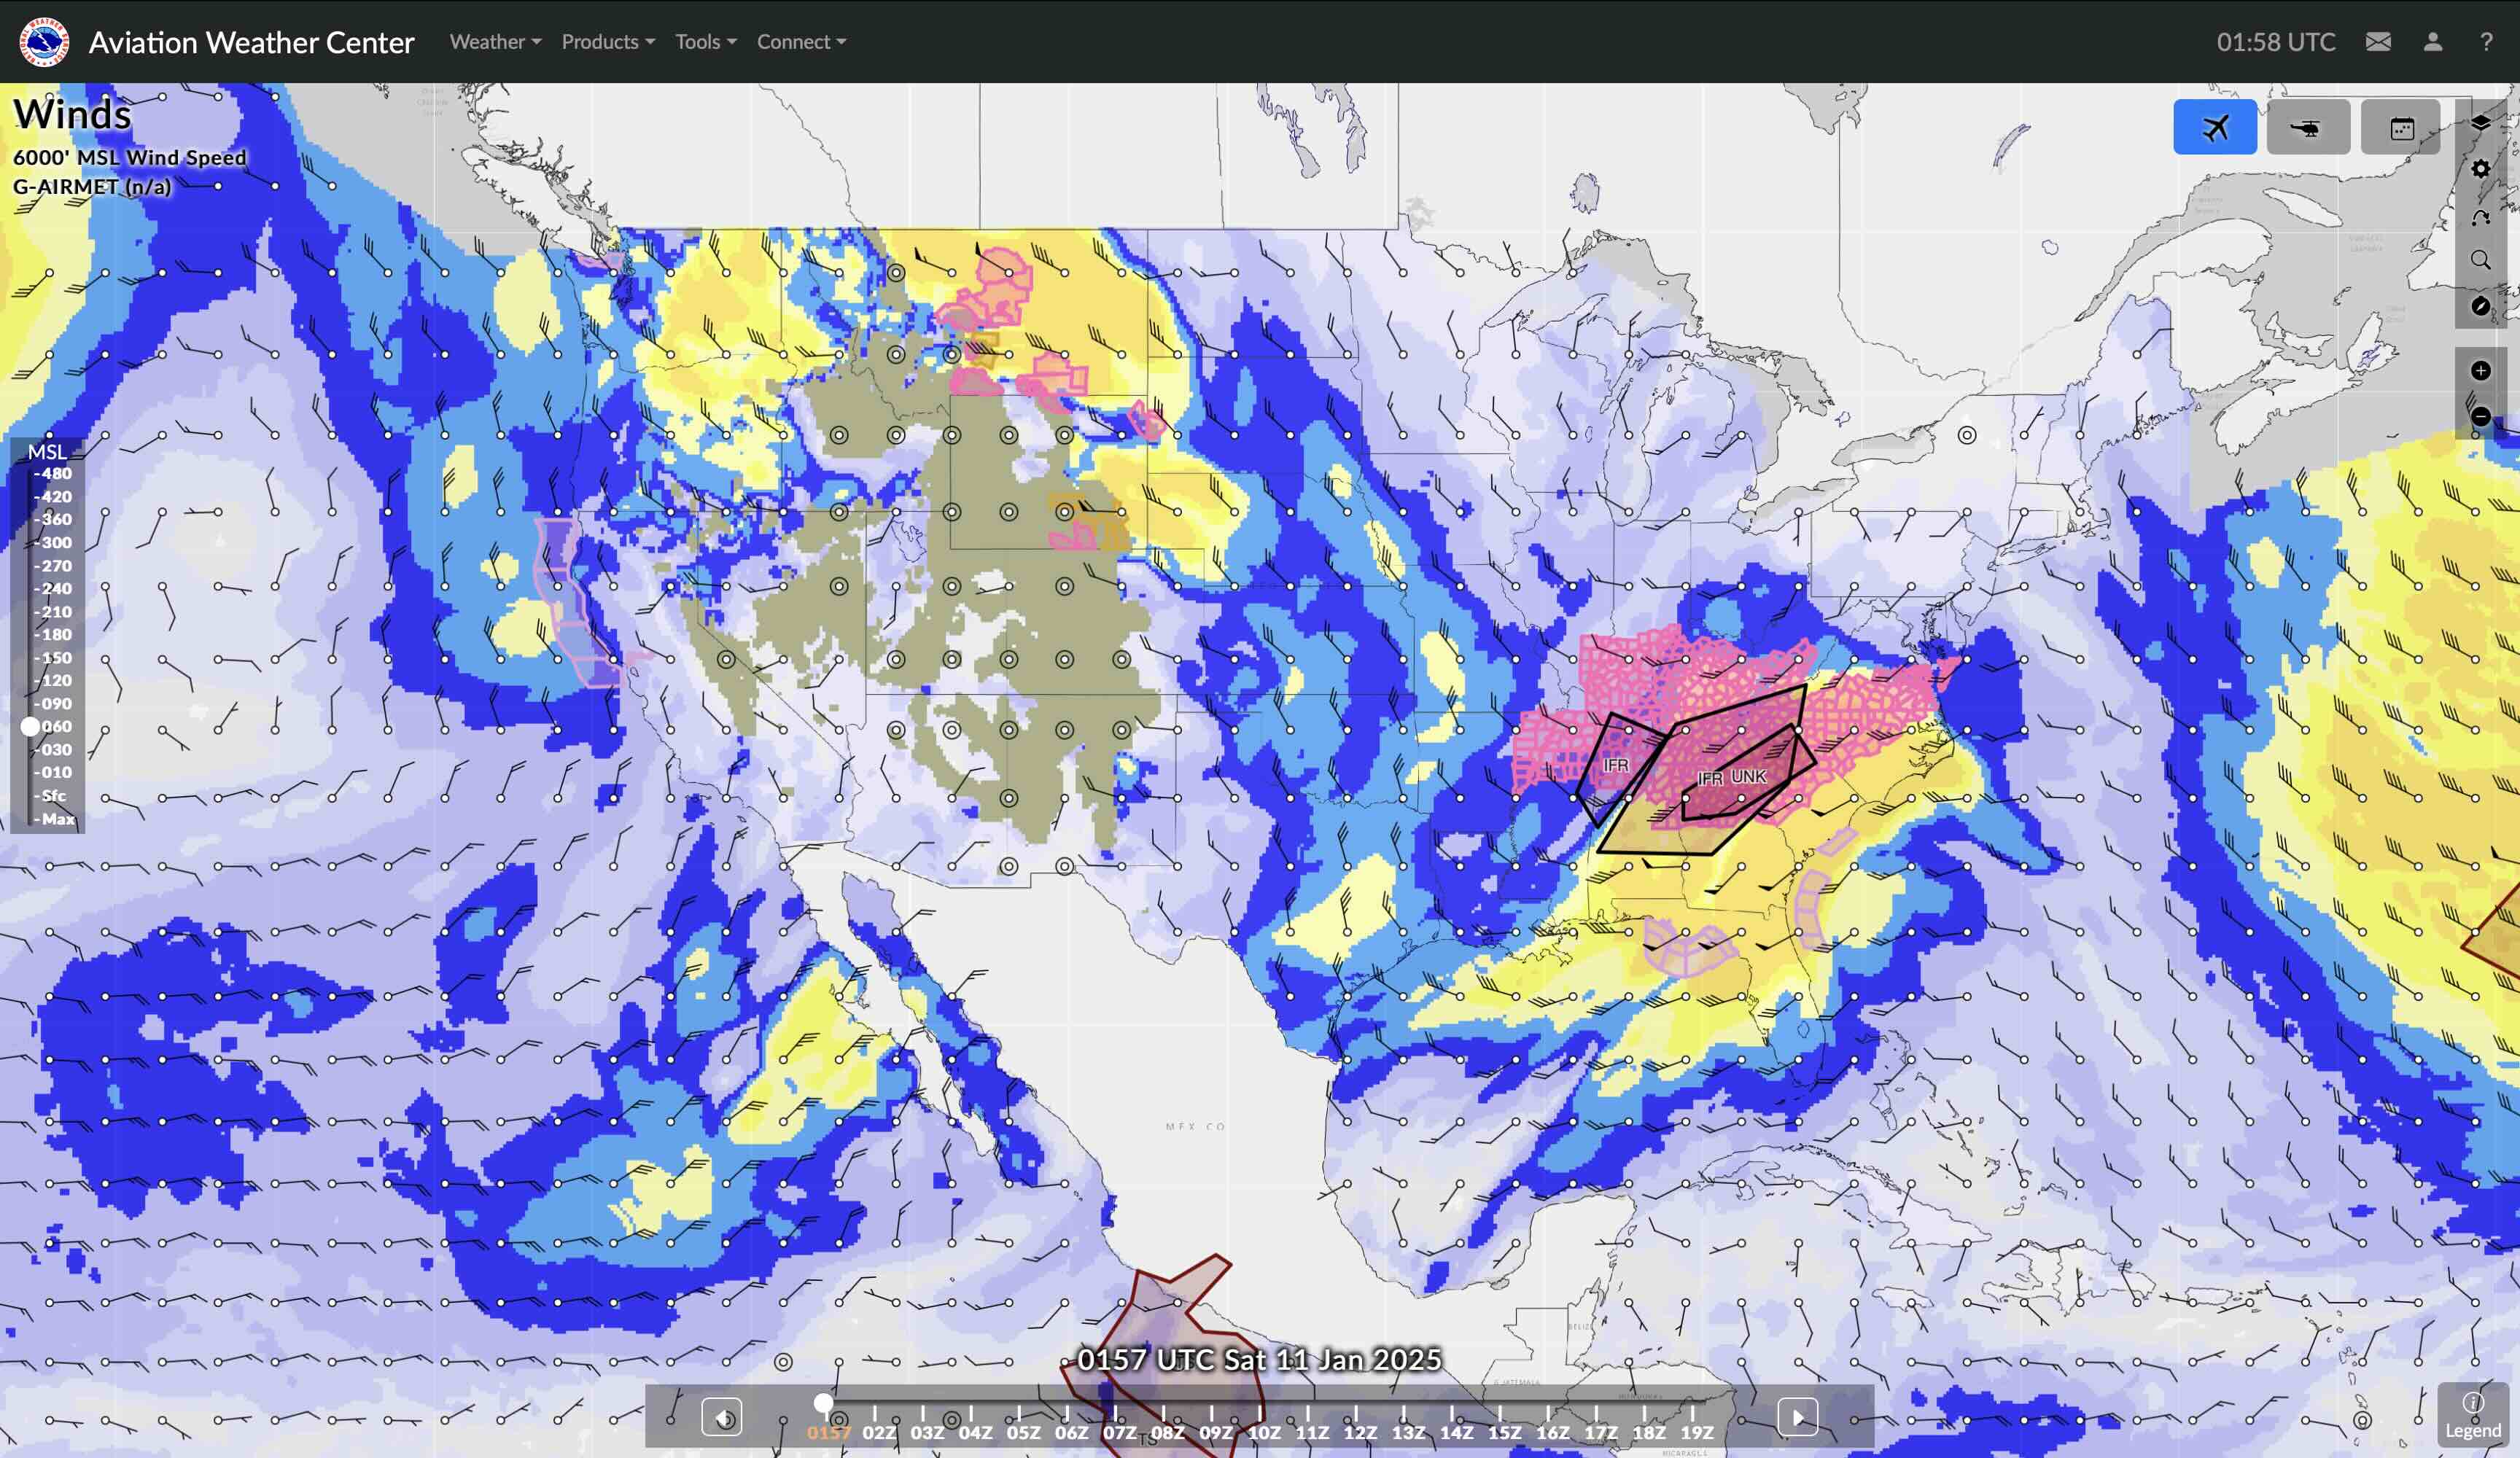
Graphical
- Winds and Temperatures Aloft Forecast - Graphical (FB)
- See Aviation Weather Center Aviation Weather Center GFA Winds Aloft
Surface Analysis Chart
- See: NOAA Surface analysis chart
- Shows pressure systems and fronts, with an overview of winds, temperatures, and dew point.
- Is an observation
- Updated every 3 hours
- Valid time, bottom left
- Isobars are spaced 4 mb apart and labeled
- Closer isobars means more wind
- H, L, Trough, Ridges
- Note: there are many different display formats of the surface analysis chart, including with color or black-and-white, or interactive maps.
- Shows:
- Fronts
- Pressure systems (high - H, low - L) labeled in underline bold pressure in mb
- Winds shown with the lines with barbs
- Sky cover shown
- Temperature and dew point
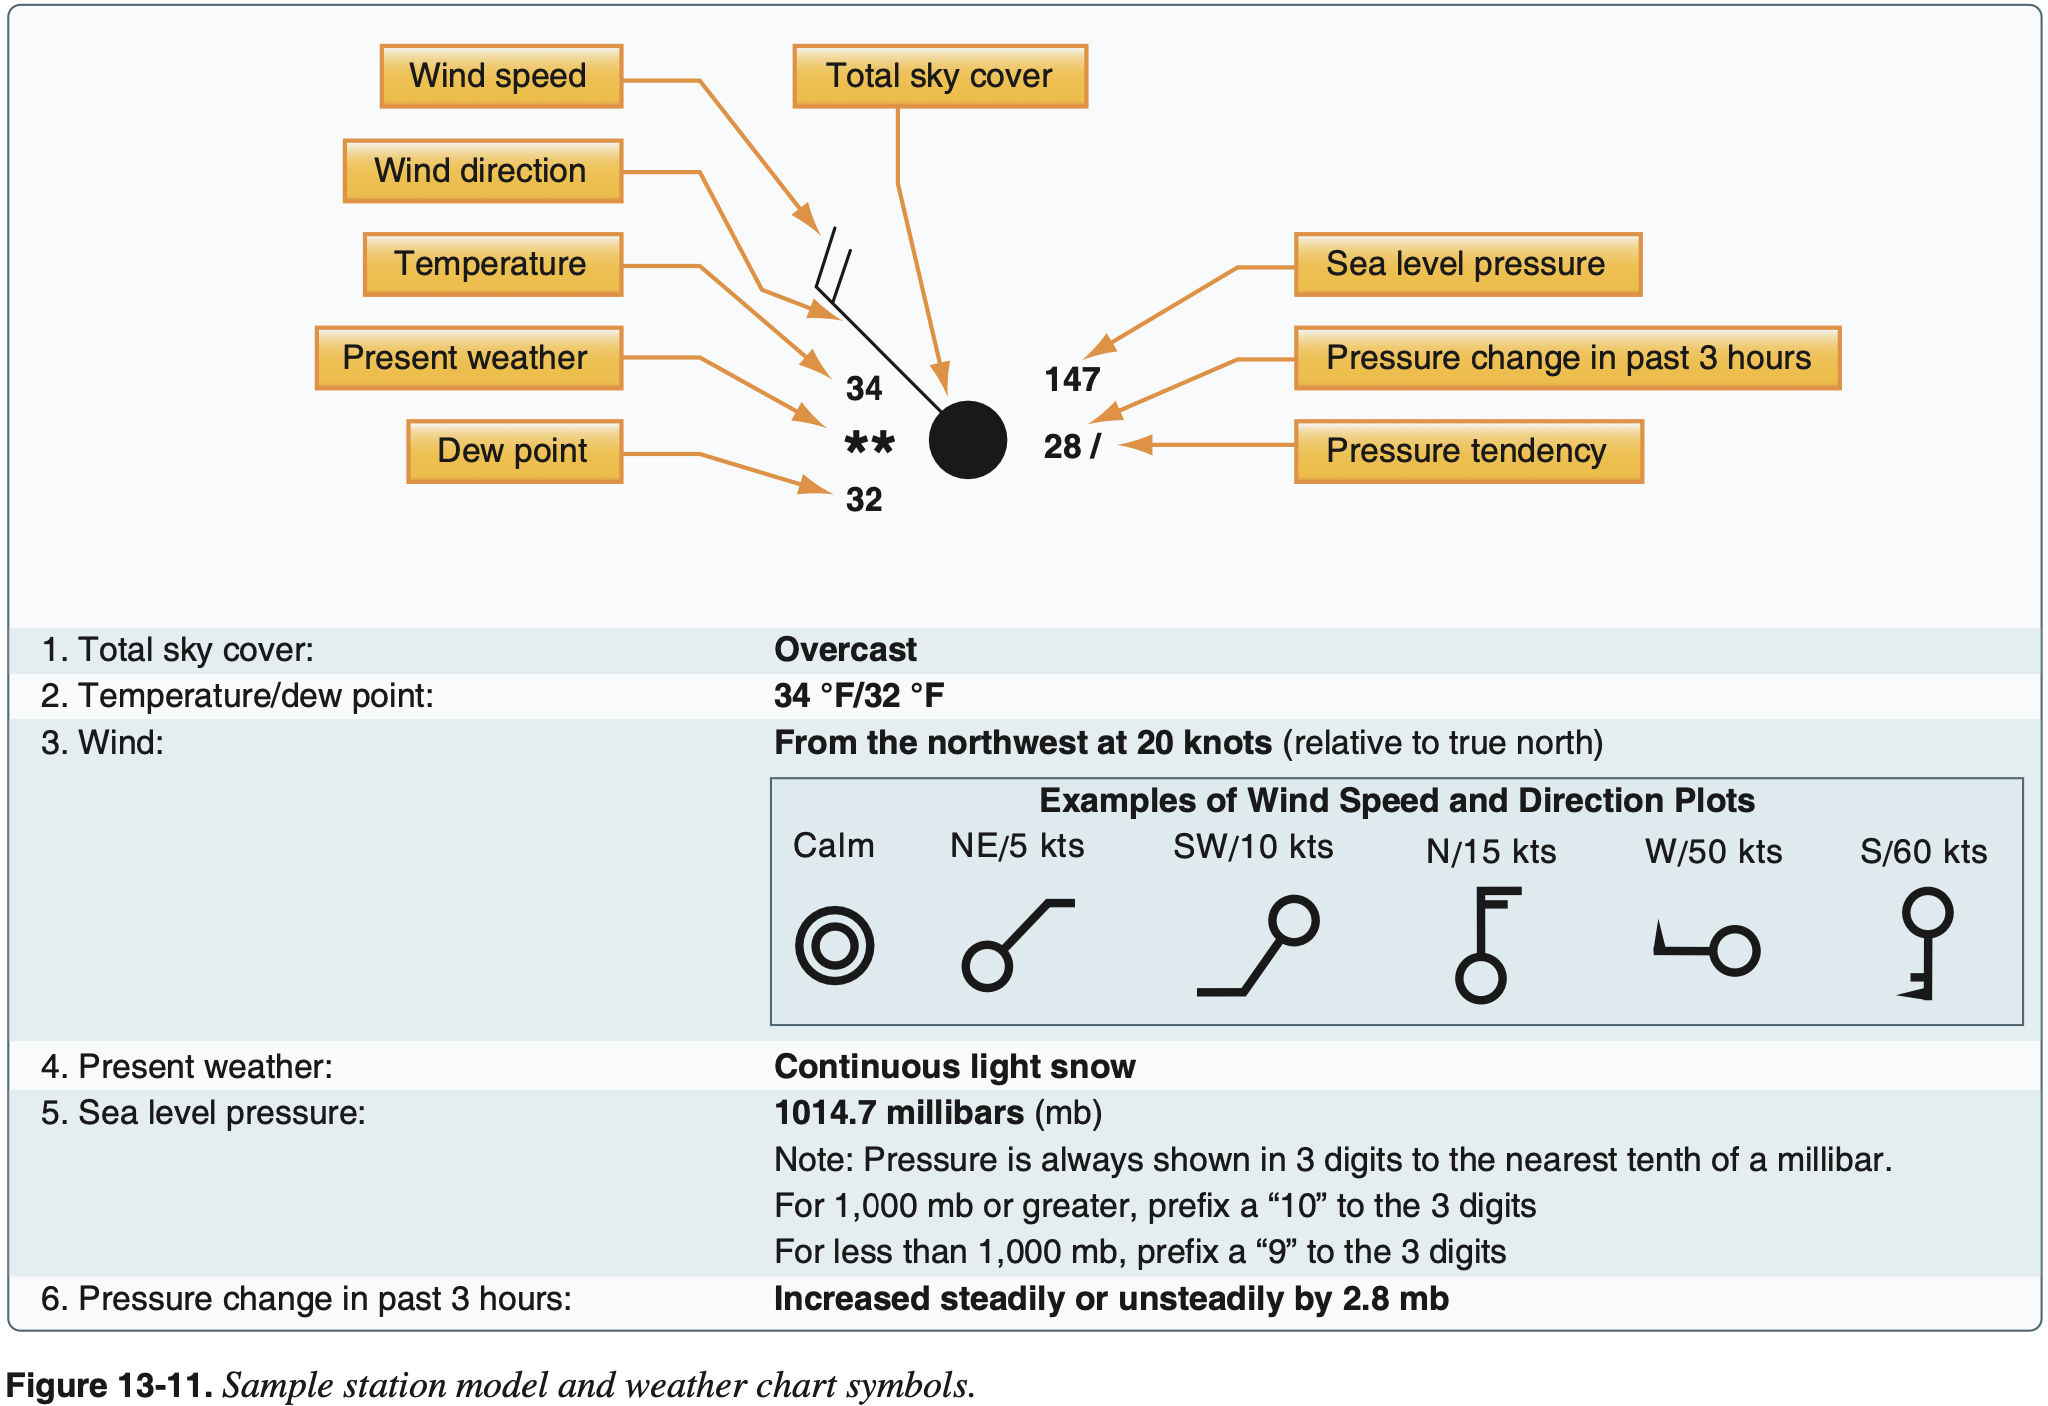
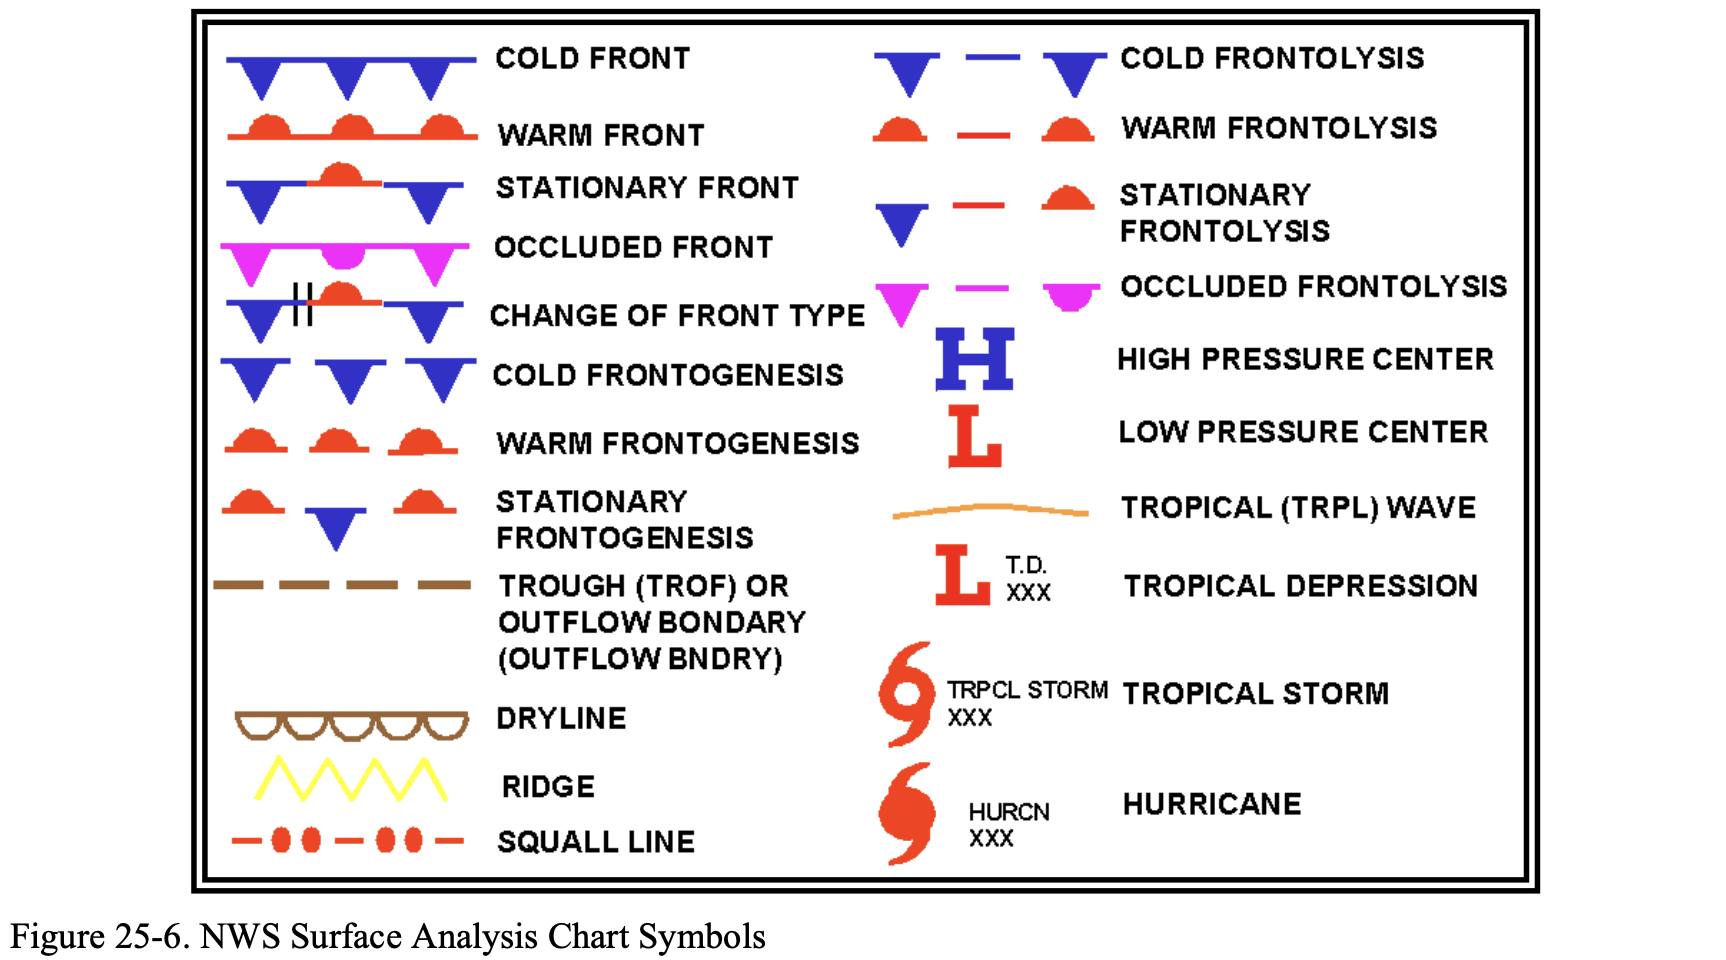
- Note: frontolysis is the weakening or dissipation of a front and frontogenesis is the strengthening of the front
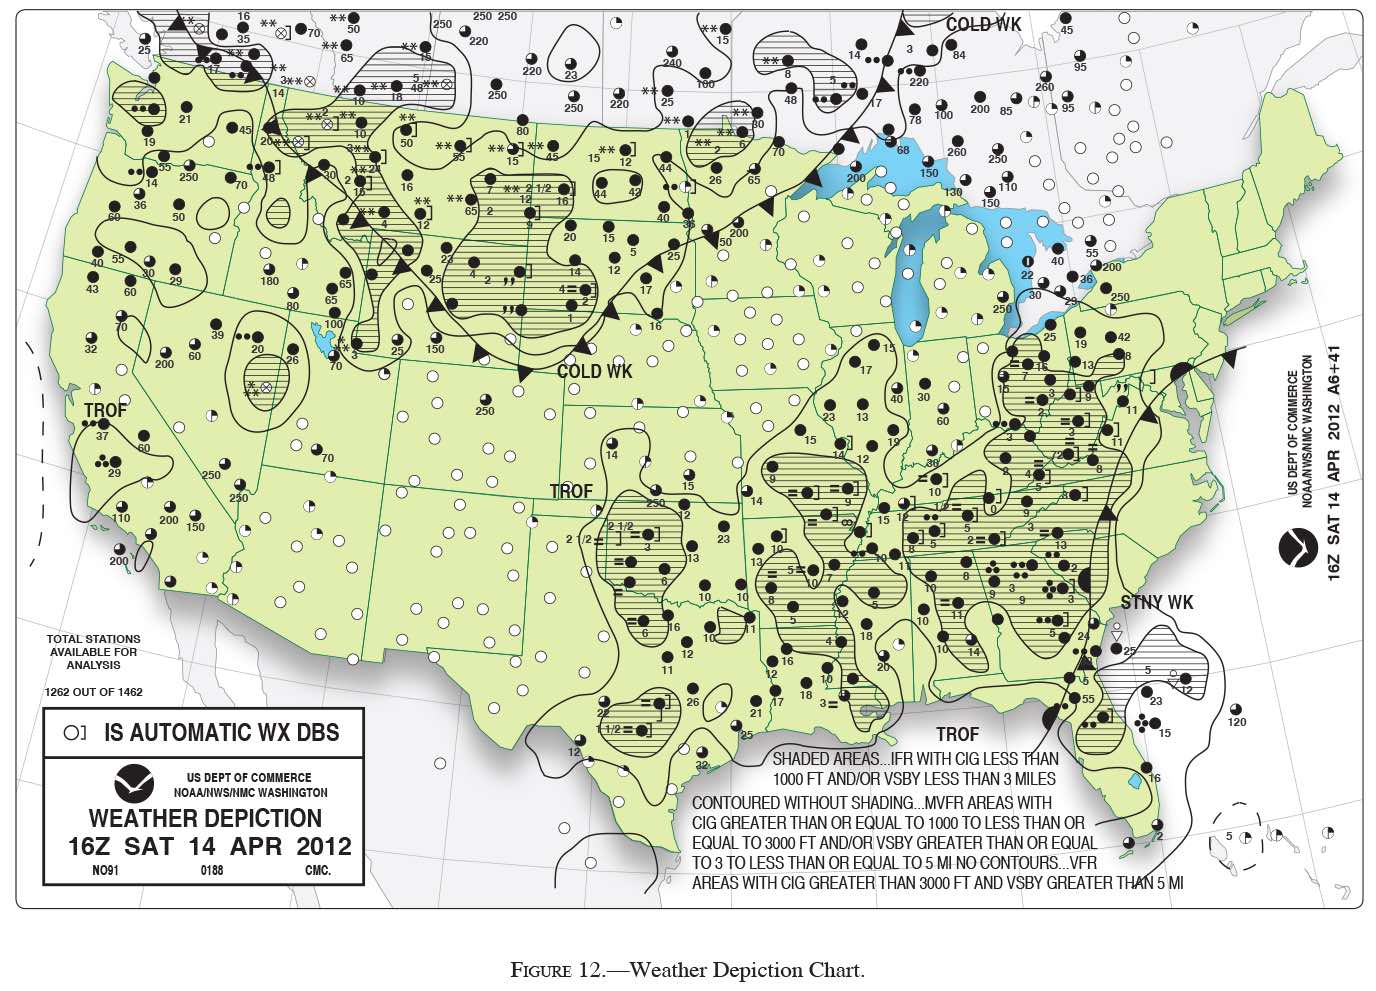
Weather Depiction Chart
From FAA-AC-00-45H Aviation Weather Services:
The Weather Depiction Chart is being phased out by the NWS, in favor of newer ceiling and visibility products, like the CVA product.
However, FAA-AC-00-45H Aviation Weather Services has been canceled by the FAA-H-8083-28A Aviation Weather Handbook.
FAA-H-8083-28A Aviation Weather Handbook has no mention of either CVA or weather depiction chart.
Nevertheless, here are some notes on what a weather depiction chart is (or was):
- A weather depiction chart details surface conditions as derived from METAR and other surface observations.
- Shows areas where conditions are reported above or below VFR weather minimums
- Observation
- Every 3 hours
- Collection of radar weather reports, updated hourly
- Good for: Weather, precipitation, cell movement
- Intensity indicated by symbols located adjacent to precipitation areas
- Arrows denote cell movement
- Note: a smooth line that is not shaded in encloses an area of MVFR
- Note: a smooth line that is shaded inside encloses an area of IFR
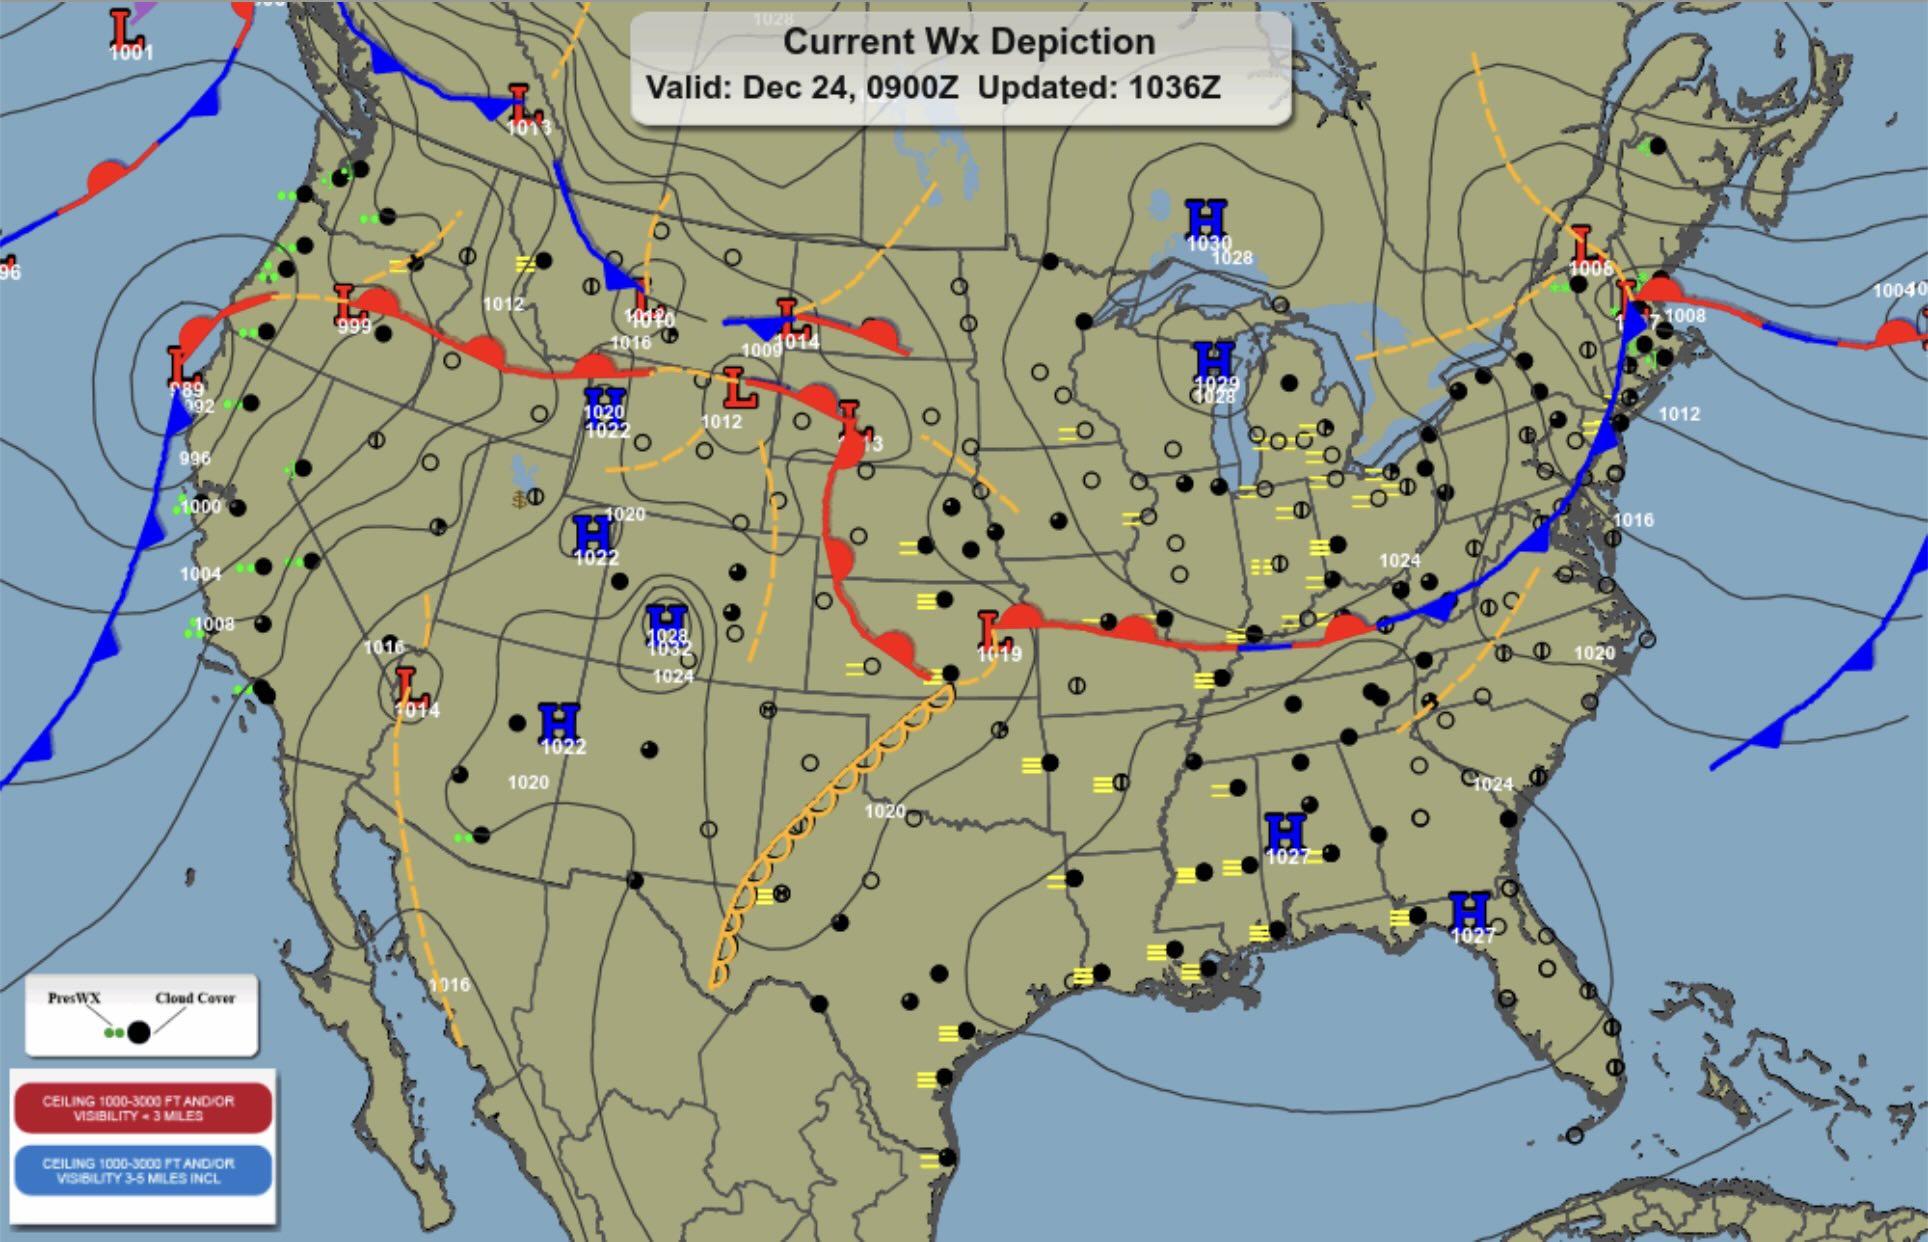
Leidos Weather Depiction Chart
- To further complicate things, weather depiction charts are still available through Flight Service.
- 1-800-WX-BRIEF: Current Wx Depiction
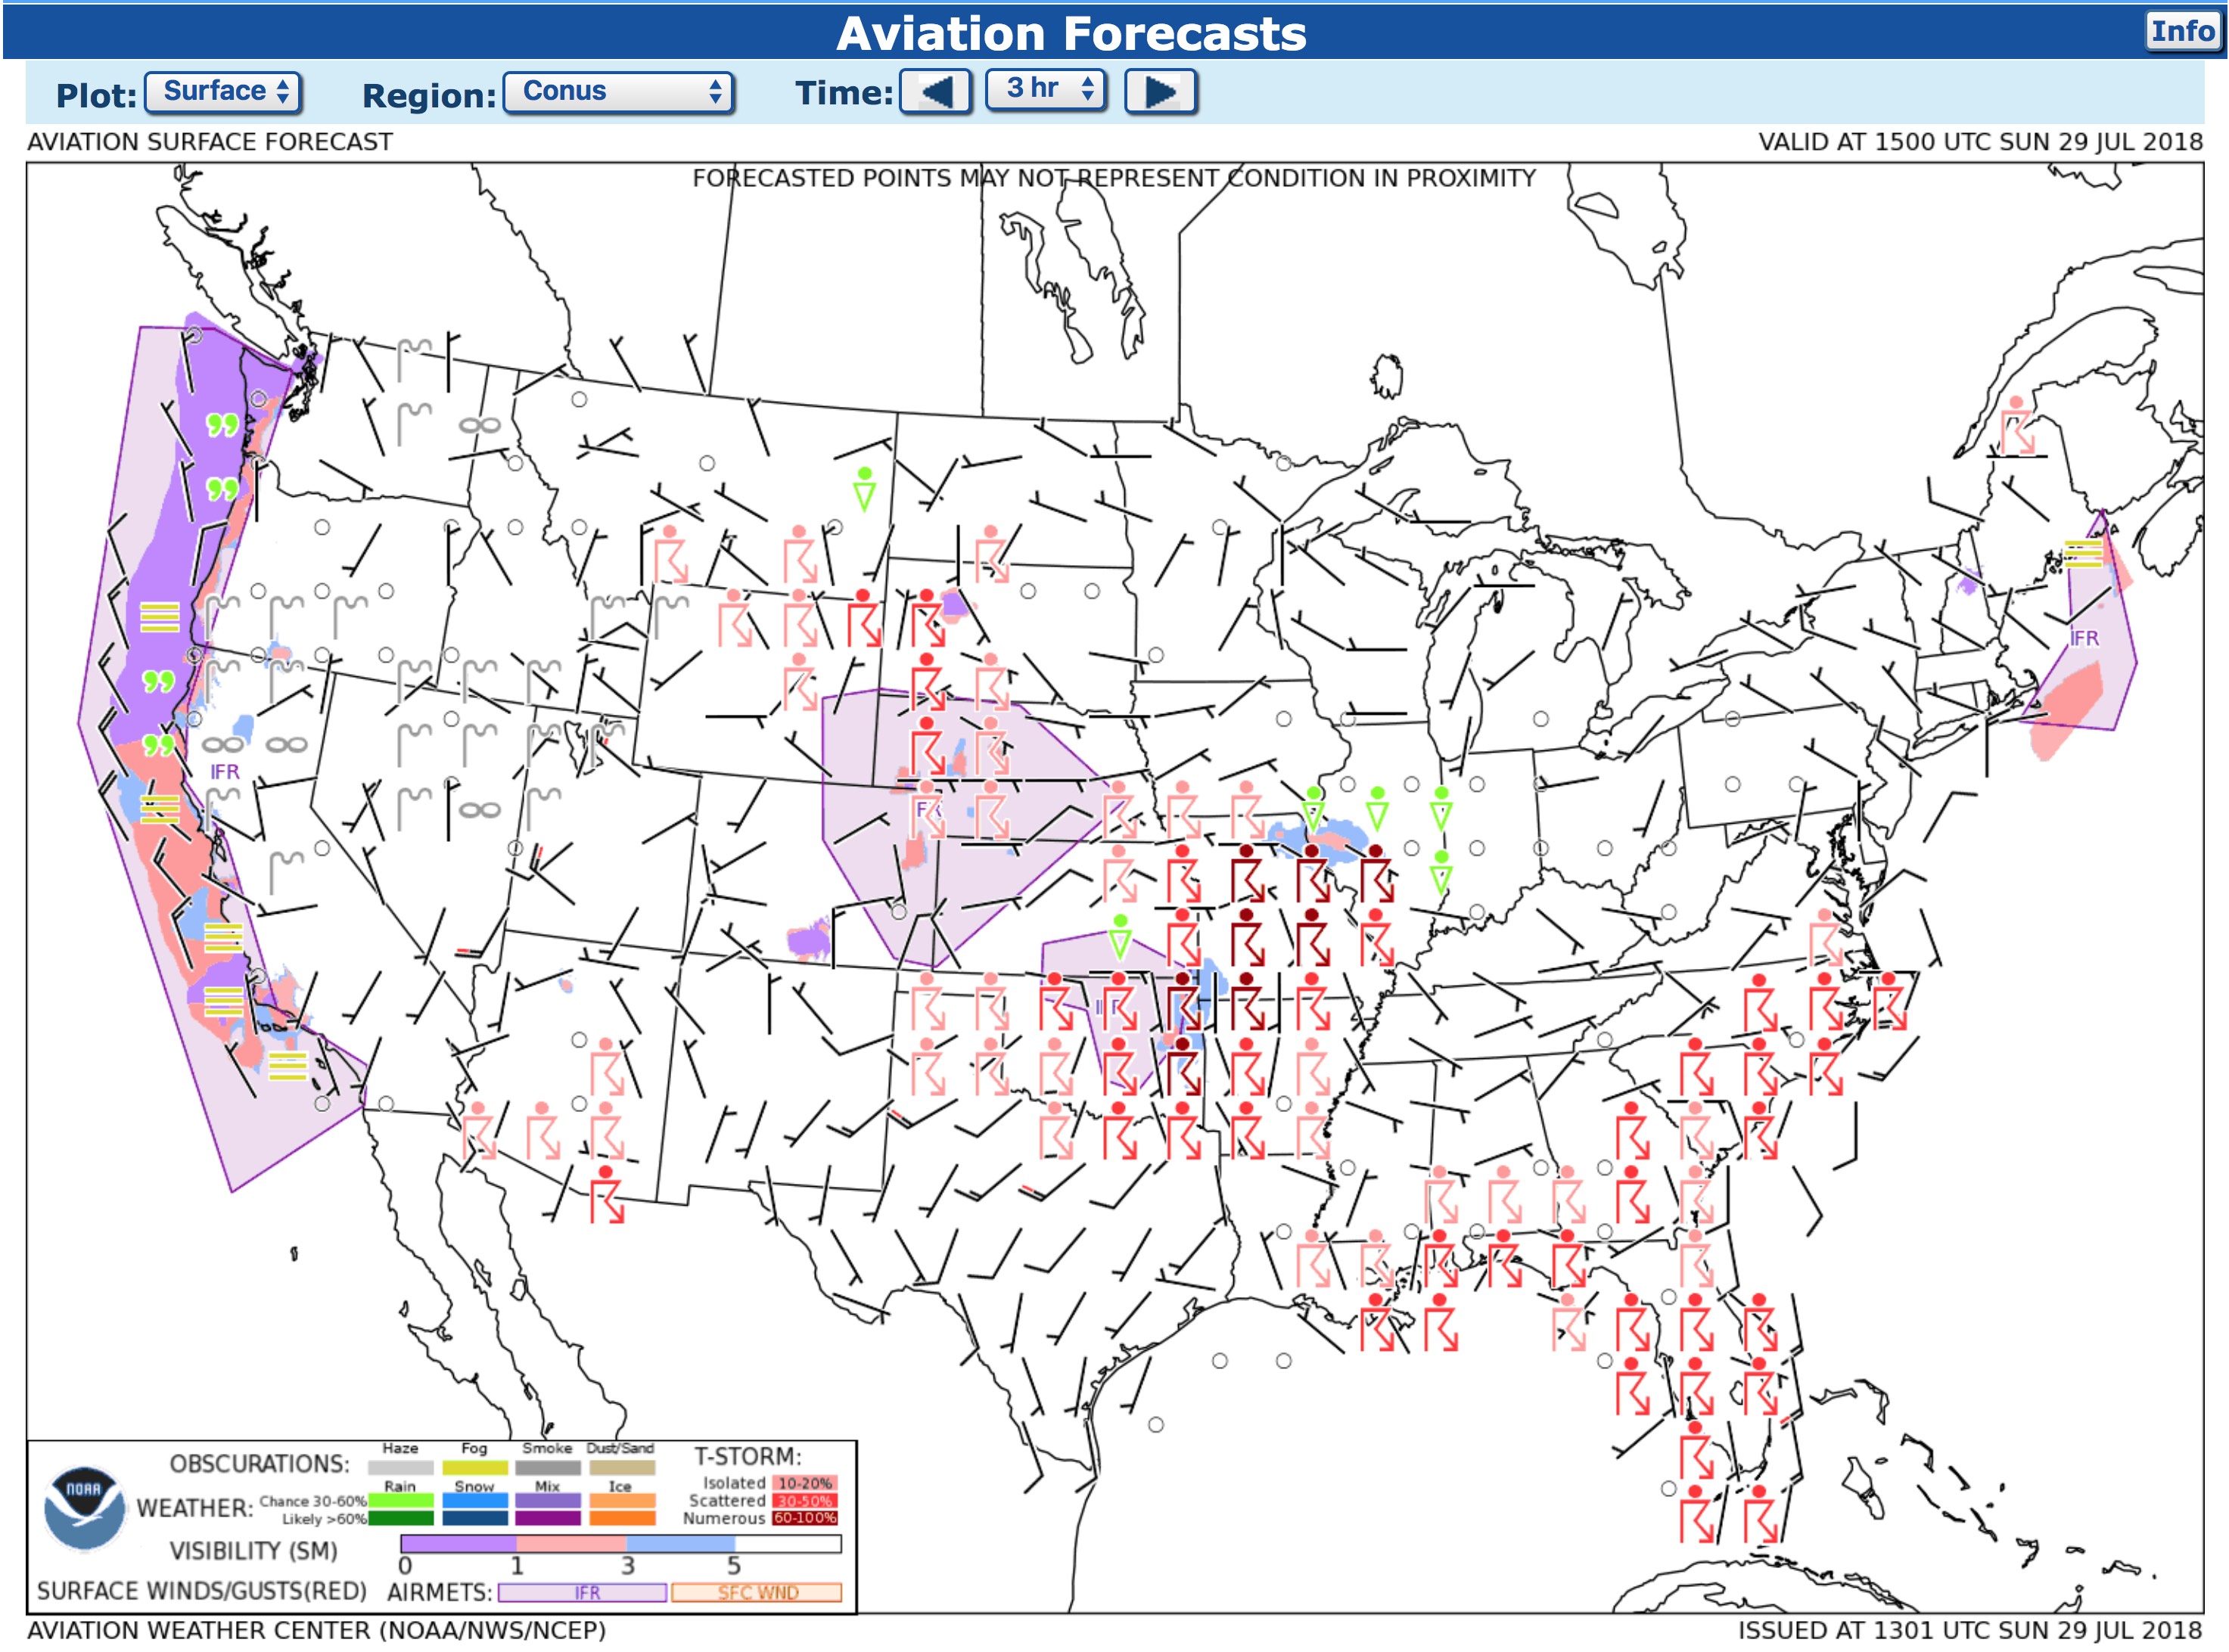
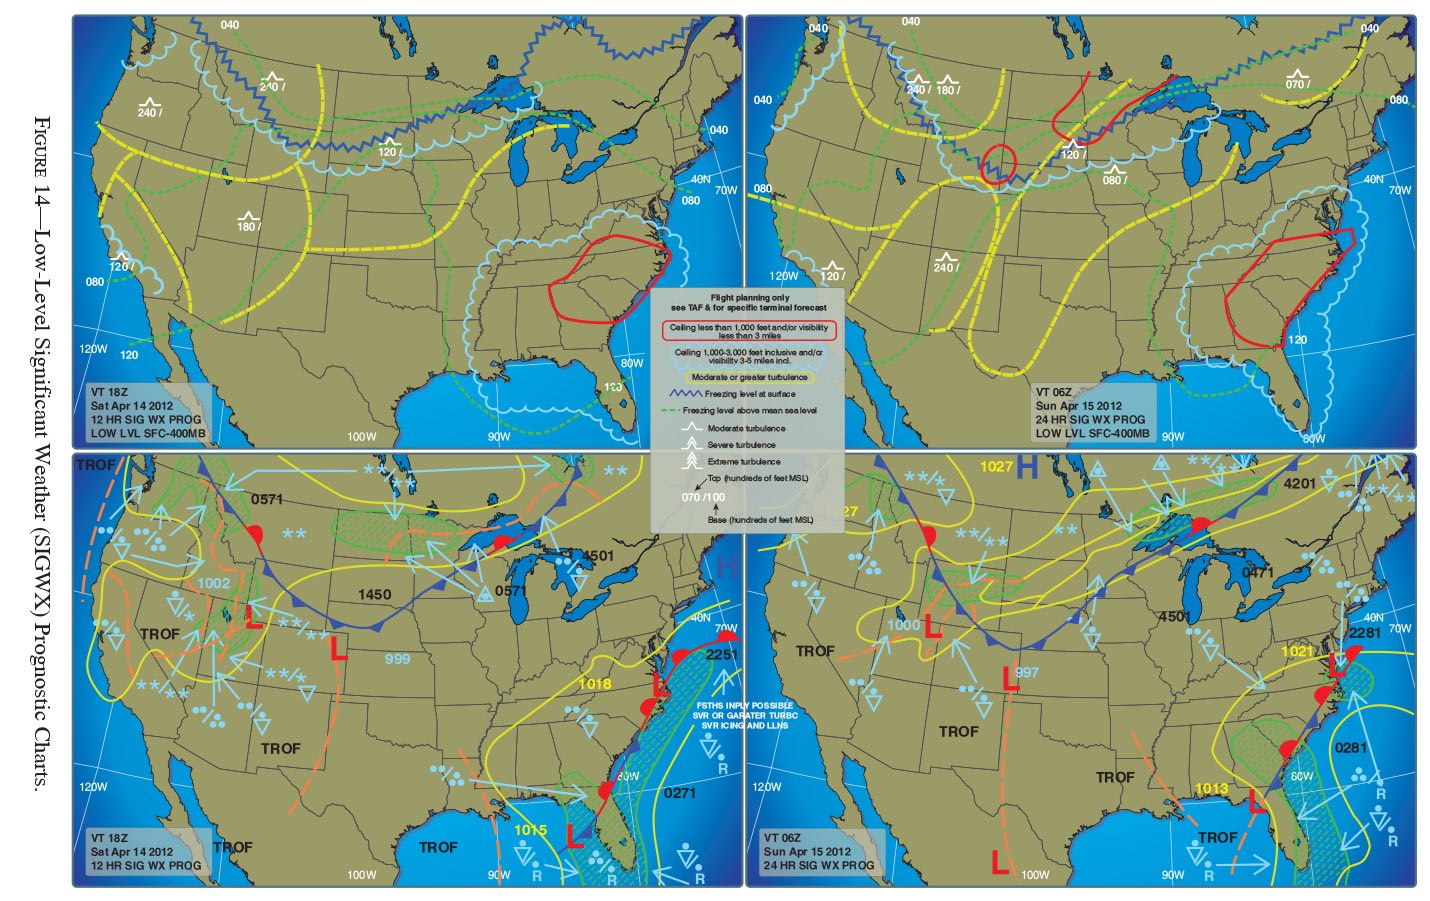
Prognostic Chart
- See: Prog Charts
- Map displaying weather forecast.
- Forecast - up to 7 days for surface
- Surface charts show pressure systems and fronts.
- Significant weather charts (surface level, low level, mid level, high level) show:
- Ceiling and visibility
- Turbulence
- Freezing levels
- One of the best uses of a low-level prognostic chart is determining areas to avoid
- Note: areas of continuous rain are hatched in but I can't find the legend for that anywhere.
- Example
**means light snow (see GFA legend above) - Snapshot of weather expected at specific time
- Low = <FL240 | High = >FL240
- Turbulence, IFR/MVFR/VFR, Ground Feezing Level
Constant Pressure Analysis
- Gives
- Wind
- Observed temperature
- Temperature/dew point spread
- For a flight at 10,000 MSL use the 700 mb chart
- This can be figured out roughly by remembering the standard sea level pressure corresponding to 29.92 inHg is 1013.2 mb and using the resulting lapse rate of 33.9 mb per 1000 ft. to get about 700 mb
- It is for "flight levels" because it is at constant pressure levels rather than constant altitude?

Convective Outlook
- Tornado, Hail 1"+, T-storms
- See the National Weather Service Storm Prediction Center Curent Convective Outlooks
Radar Weather Report
- Radar Weather Report (SD)
- Doesn't seem to exist anymore
- Gives the following for precipitation
- Location
- Type
- Intensity
- Trend
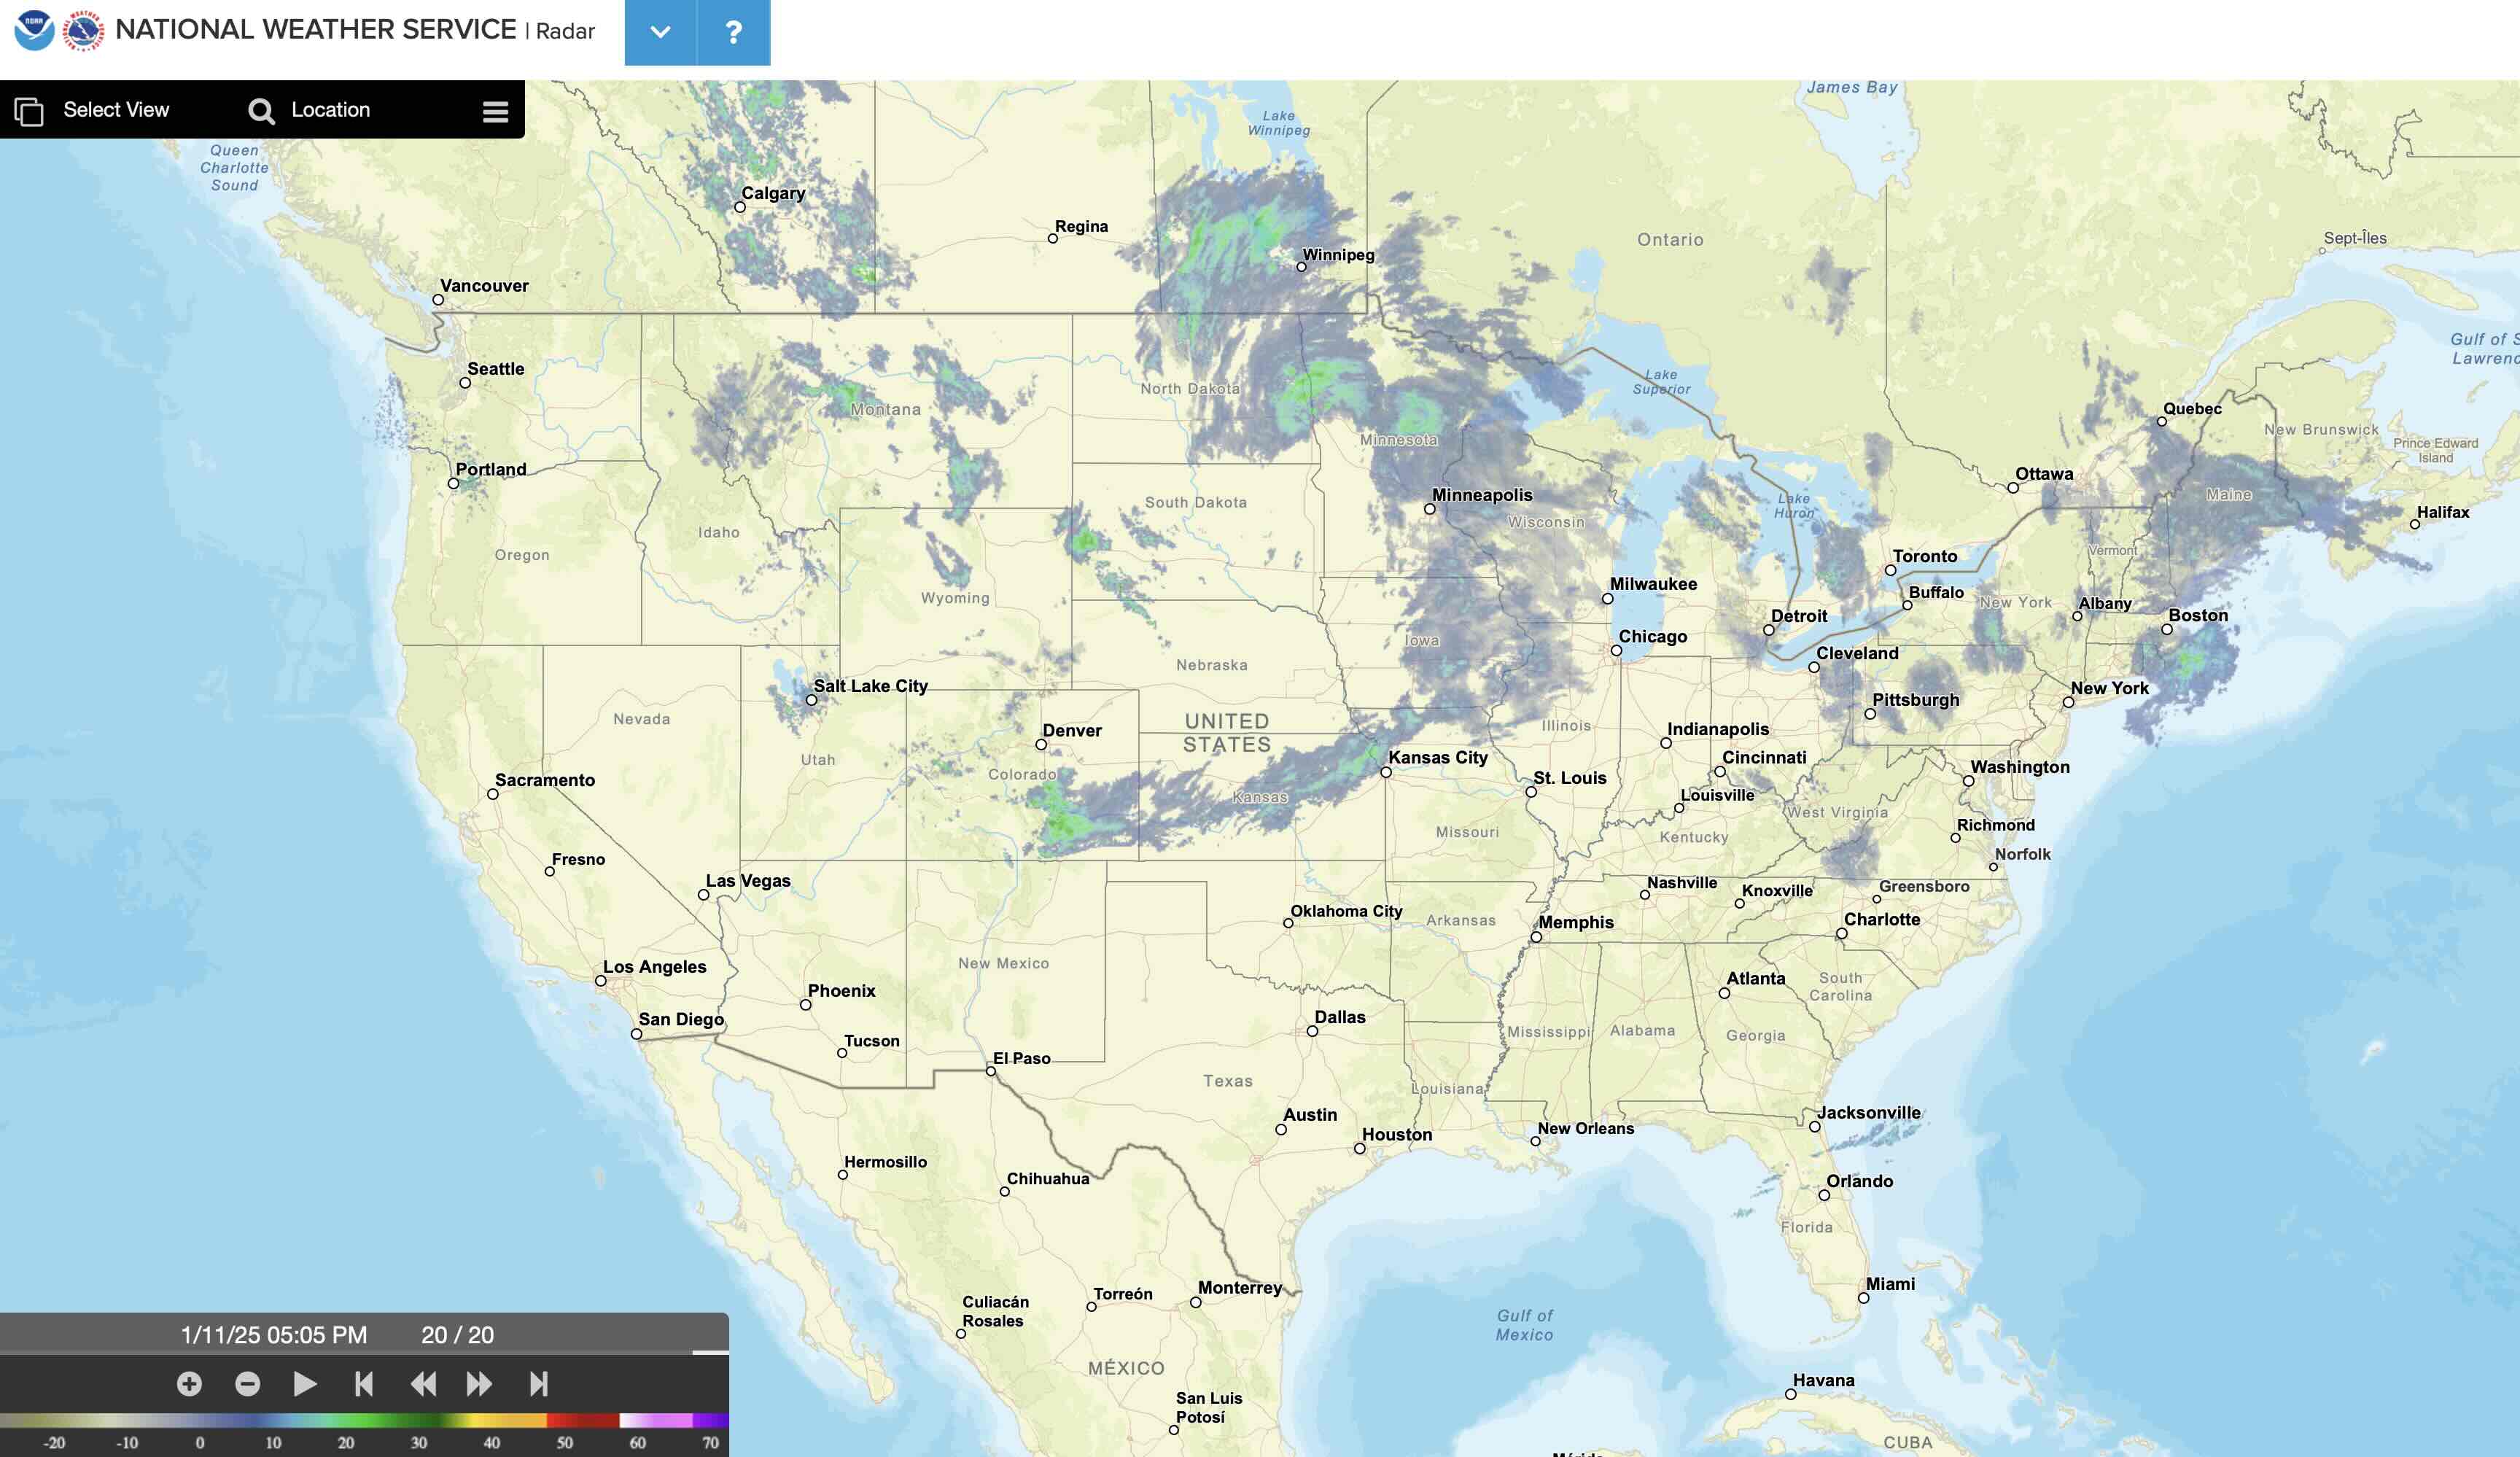
Radar Summary Chart
- The radar summary chart below does not exist at the previous URL
- See radar.weather.gov
Inflight Weather Advisories
- Center Weather Advisory (CWA)
- Current conditions and/or short term forecast
- Issued by ARTCCs
- Valid for 2 hours
SIGMETs and AIRMETs
- AIRMET (WA):
- Stands for Airmen's Meteorological Information
- Less intense than requiring a SIGMET, used in preflight to enhance flight safety.
- Forecasts valid for 6 hours
- Issued every 6 hours, as well as unscheduled updates.
- Include info about IFR, extensive mountain obscuration, turbulence, strong surface winds, icing, freezing levels.
- Of operational interest to all aircraft, potentially hazardous to light aircraft
- Pilots of heavy aircraft aren't really going to worry about AIRMETs
- Types
- Sierra: describes IFR conditions and/or extensive mountain obscurations
- Tango: Turbulence, sustained surface winds more than 30kts, low level wind shear
- Zulu: Moderate icing and freezing level heights
- Includes forecast of moderate icing, moderate turbulence, sustained surface winds of 30 knots or greater, widespread areas of ceilings less than 1,000 feet and/or visibilities less than three miles, and extensive mountain obscurement.
- https://www.aviationweather.gov/sigmet/help
- The definition here is a bit different than in PHAK, for example
- SIGMET (WS)
- Significant Meteorological Information AIM 7-1-6 Inflight Aviation Weather Advisories
- Weather that is potentially hazardous to all aircraft
- Forecasts valid for 4 hours
- Types
- Severe icing
- Severe turbulence / clear air turbulence (CAT)
- IMC due to sandstorms, volcanic ash
- Convective SIGMET (WST)
- Advises of significant weather due to thunderstorms
- Severe or greater turbulence, severe icing, low-level wind shear
- Hazardous to all categories of aircraft
- Issued hourly at H+55
- Forecasts valid for 2 hours
- Conditions to issue Convective SIGMET
- Severe thunderstorms due to 50 kts or greater surface winds or hail more than 3/4" in diameter
- Tornadoes
- A line of thunderstorms 60+ nm long
- Severe or embedded thunderstorms for 30+ minutes
- Area of thunderstorms covering at least 40% of the area concerned and exhibiting a very strong radar reflectivity or a significant satellite or lightning signature.
- Look up AIRMETs/SIGMETs online
- See also Graphical AIRMETs
Appendix
All local barometric pressure readings are converted to a sea level pressure.
- At an airport at elevation with altimeter setting of 29.92 needs to cause altimeter to read field elevation, as does an airport at sea level with altimeter of 29.92. Thus in these two cases the same altimeter setting corresponds to a different barometric pressure at the field.
- To achieve this, each station converts its barometric pressure by adding approximately 1 inHg for every 1,000 feet of elevation.
Wind directions on weather observations based on true north.
Wind direction is reported by the direction from which it originates
All charts and textual sources (METAR, TAF, winds aloft, surface analysis charts, etc) use true north as the reference.
ATIS/AWOS/ASOS broadcasts, or any information a controller gives you over the radio, is magnetic.
From AIM 7–1–10 Weather Observing Programs:
Wind direction broadcast over FAA radios is in reference to magnetic north.
TIP
The general rule regarding weather reported winds are referenced to true or magnetic direction is: if you read it, it's true. If you hear it, it's magnetic.
- Note: In the above chart, to remember that the vertically aligned dots indicate "intermittent" precipitation, the vertical dots is like an "I", for intermittent.
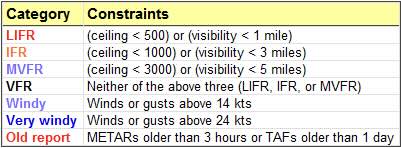
- Basic definitions used across the different products
- LIFR: Low IFR - ceiling less than 500ft and/or visibility less than 1 mile
- IFR: Ceiling 500 to less than 1,000ft and/or visibility 1 to less than 3 miles
- MVFR: Marginal VFR - ceiling 1,000 to 3,000ft and/or visibility 3 to 5 miles
- VFR: Ceiling greater than 3,000ft and visibility greater than 5 miles, sky clear
- Ceiling is the lowest layer of clouds reported as being broken or overcast
- or the vertical visibility into an obscuration like fog or haze
- Visibility is the greatest horizontal distance at which prominent objects can be viewed with the naked eye
- https://www.aviationweather.gov/adds/
- https://www.aviationweather.gov/briefing
- http://www.wpc.ncep.noaa.gov/html/sfc2.shtml
Other Tools
Onboard Weather
- Onboard Weather Radar
- Most up-to-date weather information available
- May be used for "tactical" weather avoidance
- Good supplement to existing weather sources
- Has limitations like blind splot where distant weather can be blocked by near weather
- XM lightning
- Lightning strikes sensed by ground stations
- Lightning can't hide from ground stations
- Broadcast to plane via satellite
- NEXRAD
- Ground-based radar information broadcast to planes via satellite
- Information may be 15 minutes or more old
- NEXRAD and ADS-B weather both come from NWS
- ADS-B
- Flight Information Services-Broadcast (FIS-B)
- Information sent directly to planes from ground stations
- Usually no more than 5 minutes old
- Flight service
- Nationwide on 122.2
- Available over most VORs
- Hazardous Inflight Weather Advisory Service (HIWAS)
- Continuous broadcast service over selected VORs of Inflight Weather Advisories; i.e. SIGMETs, CONVECTIVE SIGMETs, AIRMETs, Severe Weather Forecast Alerts (AWWs), and Center Weather Advisories (CWAs).
- Discontinued in 2020
Weather Briefing
- Four types of weather briefings
- Outlook briefing
- More than 6 hours in advance
- Will get mostly forecast information without bothering too much with current conditions
- Standard briefing
- Immediately before flight (within 6 hours of your departure time)
- Abbreviated briefing
- If you've already received an outlook briefing
- There is no standard format, need to tell the briefer what info you need
- In flight briefing
- Outlook briefing
- Weather briefings can be obtained
- By calling 1-800-WX-BRIEF
- 1800wxbrief.com
- Provided by Leidos Flight Service
- The FAA-contracted Flight Service provider/resource
- Foreflight, Garmin Pilot, etc.
References
- FAA-H-8083-28A Aviation Weather Handbook
- AIM 7-1-28 Key to Aerodrome Forecast (TAF) and Aviation Routine Weather Report (METAR)
- FAA-H-8083-25B Pilot's Handbook of Aeronautical Knowledge
- Chapter 4: Principles of Flight
- Chapter 12: Weather Theory
- Chapter 13: Aviation Weather Services
- Page 13-4: Transcribed Weather Broadcast (TWEB) (Alaska Only)
- FNL Pilots METAR Remarks
- FAA METAR Abbreviations
- http://meteocentre.com/doc/metar.html
- Note FAA-H-8083-28A ultimately will cancel the following